What Are Nifty Smallcap 250 Stocks?
The National Stock Exchange (NSE) ranks stocks from 1 to 500 under the Nifty 500 index. This ranking is based on specific parameters that ensure a systematic and transparent selection process:
Topics of Discussion
Ranking Parameters
- Free Float Market Capitalisation: This is the total market capitalisation of a company, excluding the holdings of promoters and owners.
- Liquidity: Stocks with higher trading volumes and ease of transactions may rank higher, even if their free float market capitalisation is lower.
- Periodic Rebalancing: NSE rebalances its indices semi-annually based on a fixed formula. These rankings are objective, and no NSE member can influence the results.
Classification of Stocks
- Nifty 50 Stocks: Ranked 1 to 50
- Nifty Next 50 Stocks: Ranked 51 to 100
- Nifty Midcap 150 Stocks: Ranked 101 to 250
- Nifty Smallcap 250 Stocks: Ranked 251 to 500
Characteristics of Smallcap Stocks
- High Growth Potential: Smallcap stocks can deliver significant returns over time due to their growth prospects.
- High Volatility and Risk: These stocks are highly volatile and often carry greater business risk. Smaller companies may struggle to compete with established large and midcap firms, and their fundamentals are generally weaker.
- Liquidity Concerns: Lower liquidity can make these stocks susceptible to price manipulation. While NSE protects small investors by freezing trades at a 5% threshold, risks remain during bear markets when buyers are scarce.
- Trading Recommendation: Smallcap stocks are best suited for experienced traders. Beginners should exercise caution and may consider avoiding this segment due to its inherent risks.
What is Breakout Stocks
Refer the article below to know about Breakout Stocks.

8 Nifty Next 50 Breakout Stocks for 10th -14th November 2025 with Price Projection
Learn how to project price movement after a positive breakout using the Fibonacci method. Understand how adding 37.5% of the last intermediate-term rally to the previous all-time high...
Read More →How All Time High Breakout Work
When a stock reaches an all-time high, it signals strong underlying strength and positive market sentiment. Often, after such a rally, the stock may experience a pullback. This temporary decline should not be interpreted as weakness; rather, it is a natural consolidation phase that allows the stock to stabilize before its next upward move.
Once the stock reclaims its previous all-time high and ultimately breaks above it, this breakout demonstrates even greater internal strength than before. Such a move provides a strong indication that the stock is likely to continue its upward trajectory, presenting a favorable opportunity for investors.
List of Smallcap Breakout Stocks
Here is a list of 6 reliable Smallcap Breakout Stocks
- Multi Commodity Exchange of India Ltd
- Laurus Labs Ltd
- Radico Khaitan Ltd
- Poonawalla Fincorp Ltd
- Navin Fluorine International Ltd
- HBL Engineering Ltd
Table 1 : Projection Levels of Breakout Stocks
| Stocks | Starting Value | Breakout at | Projection (37.5%) | Projection (50%) | Projection (62.5%) | Projection (100%) |
|---|---|---|---|---|---|---|
| MCX | 4408 | 9128 | 10898 | 11488 | 12078 | 13848 |
| Laurus Labs | 518 | 946 | 1106.5 | 1160 | 1213.5 | 1374 |
| Radico Khaitan | 1852 | 2642 | 2938.25 | 3037 | 3135.75 | 3432 |
| Poonawalla Fin | 268 | 268 | 268 | 268 | 268 | 268 |
| Navin Fluor | 5448 | 3196 | 2351.5 | 2070 | 1788.5 | 944 |
| HBL Engine | 406 | 742 | 868 | 910 | 952 | 1078 |
Breakout Stock 1 : Multi Commodity Exchange of India Ltd
Chart Interpretation —
The above chart represents the Weekly Candlestick Chart of Multi Commodity Exchange of India Ltd. Price action is moving inside an uptrending channel, bounded by two ascending trendlines; the channel area is shaded in grey on the chart.
A breakout level is marked at ₹9128 (black horizontal line). The start of the short-term uptrend is marked at ₹4408.
Using the Fibonacci projection method, projection targets lie at 37.5%, 50%, 62.5% and 100%. The exact projection prices for this stock are shown in “Table 1 – Projection Levels of Breakout Stocks” above in this article.
Company Features
Established in November 2003, MCX is India’s first listed and largest commodity derivatives exchange, operating under SEBI. It provides an electronic platform for price discovery and risk management in commodities.
Market Position:
Holds a 95.9% market share in India’s commodity futures segment (FY24).
Commands 100% share in precious metals & stones, 99.6% in energy, and 99.8% in base metals.
Minor presence (2.65%) in agri-commodities.
Ranked 7th globally in commodity futures traded and 6th in options.
Its only competitor, NCDEX, holds the remaining 3.9% share.
Breakout Stock 2 : Laurus Labs Ltd
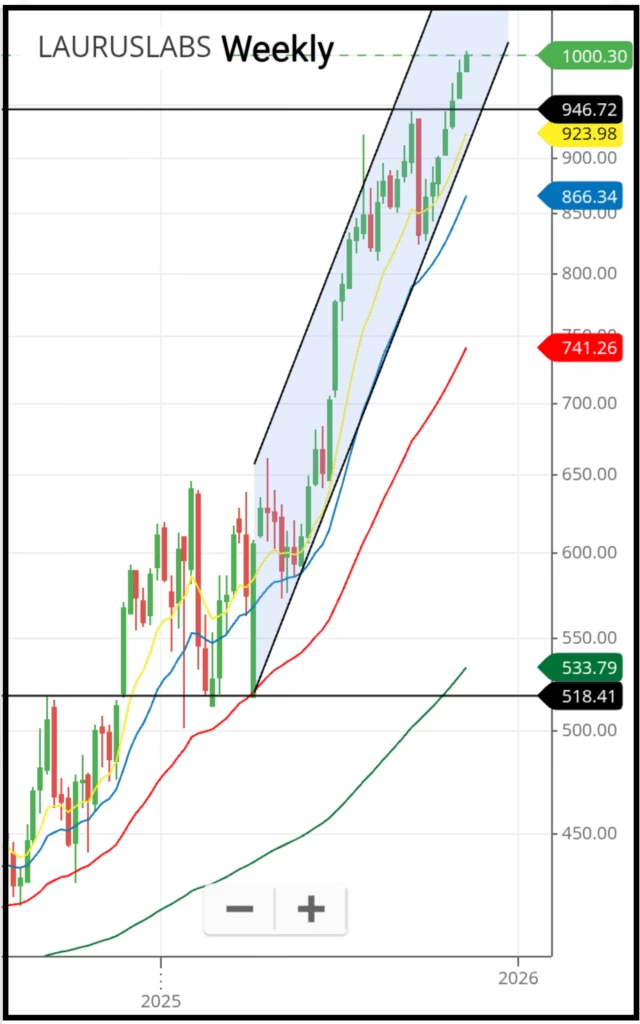
Chart Interpretation —
The above chart represents the Weekly Candlestick Chart of Laurus Labs Ltd. Price action is moving inside an uptrending channel, bounded by two ascending trendlines; the channel area is shaded in grey on the chart.
A breakout level is marked at ₹946 (black horizontal line). The start of the short-term uptrend is marked at ₹518.
Using the Fibonacci projection method, projection targets lie at 37.5%, 50%, 62.5% and 100%. The exact projection prices for this stock are shown in “Table 1 – Projection Levels of Breakout Stocks” above in this article.
Company Features
Founded in 2005, Laurus Labs is a research-driven pharmaceutical and biotechnology company with leadership in Active Pharmaceutical Ingredients (APIs) such as anti-retrovirals, oncology, cardiovascular, and gastro therapeutics.
Highlights:
Provides integrated CMO & CDMO services — from clinical drug development to commercial manufacturing.
Employs 6,500+ people, including 1,050+ scientists.
Operates 11+ global-standard facilities approved by agencies like USFDA, WHO, EMA, TGA, Japan-PDMA, and UK-MHRA.
Breakout Stock 3 : Radico Khaitan Ltd
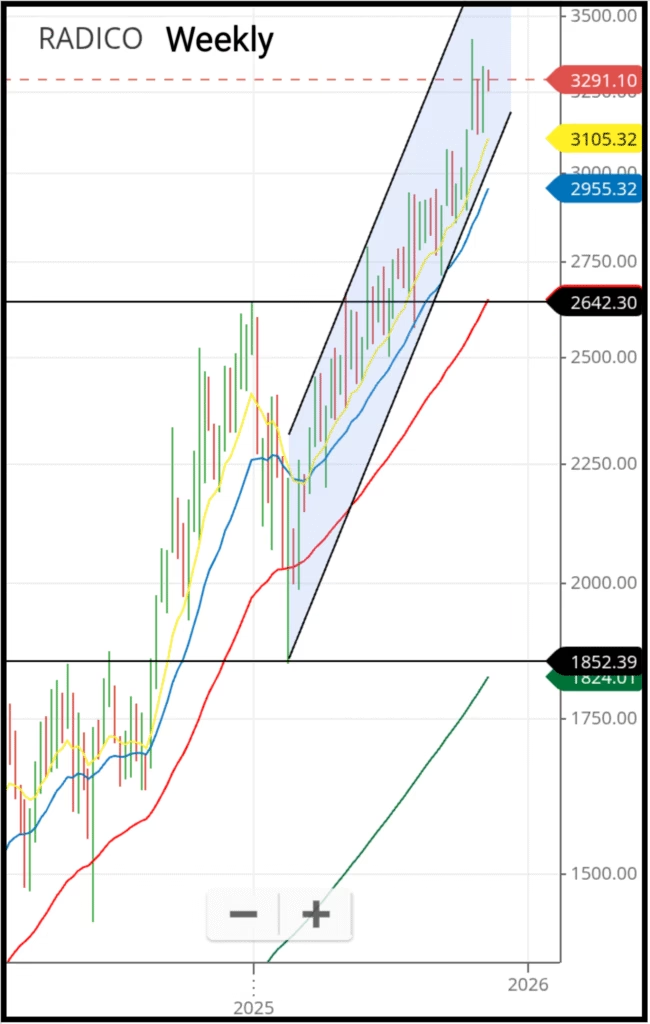
Chart Interpretation —
The above chart represents the Weekly Candlestick Chart of Radico Khaitan Ltd. Price action is moving inside an uptrending channel, bounded by two ascending trendlines; the channel area is shaded in grey on the chart.
A breakout level is marked at ₹2642 (black horizontal line). The start of the short-term uptrend is marked at ₹1852.
Using the Fibonacci projection method, projection targets lie at 37.5%, 50%, 62.5% and 100%. The exact projection prices for this stock are shown in “Table 1 – Projection Levels of Breakout Stocks” above in this article.
Company Features
Incorporated in 1943 (as Rampur Distillery Company), Radico Khaitan is one of India’s oldest and largest IMFL (Indian Made Foreign Liquor) manufacturers.
Evolution & Market Leadership:
Shifted from bottling for other brands to launching its own IMFL in 1997, starting with 8PM Whisky, which became a million-case brand within a year.
A leading supplier to India’s Canteen Stores Department (CSD) and the largest malt distiller in the country.
Among India’s top alcohol exporters, reaching 102+ countries.
Breakout Stock 4 : Poonawalla Fincorp Ltd
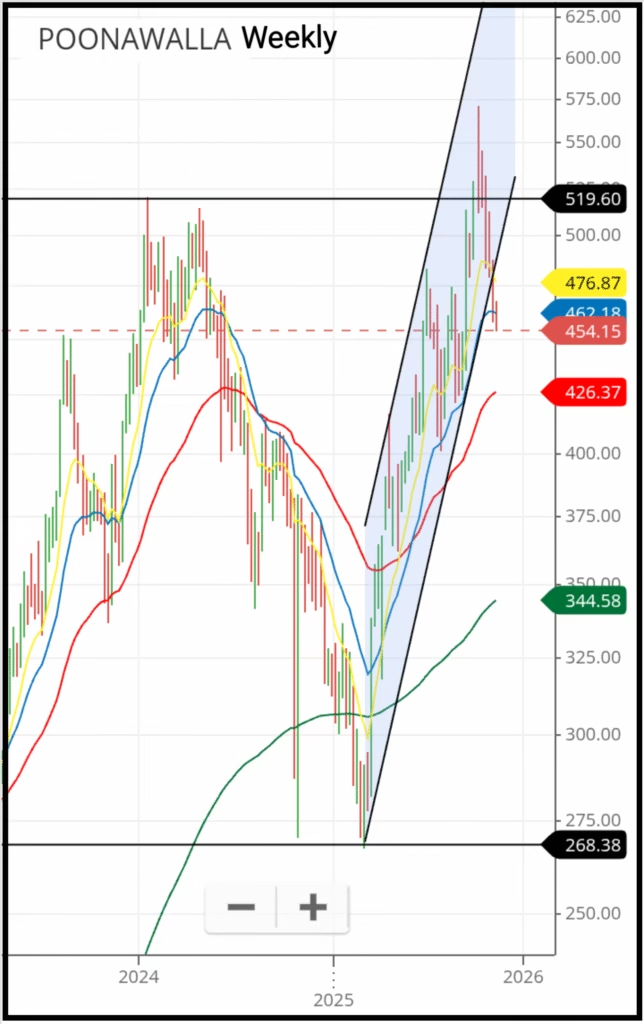
Chart Interpretation —
The above chart represents the Weekly Candlestick Chart of Poonawalla Fincorp Ltd. Price action is moving inside an uptrending channel, bounded by two ascending trendlines; the channel area is shaded in grey on the chart.
A breakout level is marked at ₹519 (black horizontal line). The start of the short-term uptrend is marked at ₹268.
Using the Fibonacci projection method, projection targets lie at 37.5%, 50%, 62.5% and 100%. The exact projection prices for this stock are shown in “Table 1 – Projection Levels of Breakout Stocks” above in this article.
Company Features
Formerly Magma Fincorp Ltd — a non-deposit-taking NBFC, offering consumer, MSME, and professional loans, as well as general insurance services.
Ownership & Financials:
Controlled by Cyrus Poonawalla Group (61.87%) through Rising Sun Holdings Pvt. Ltd.
RSHPL infused ₹3,206 Cr in equity in May 2021.
Product Portfolio:
Pre-owned car loans: ₹1L–₹75L, 12–72 months, from 11% p.a.
Personal loans: ₹1L–₹30L, 12–60 months, from 9.99% p.a.
Business loans: ₹1L–₹50L, 6–48 months, from 15% p.a.
Loan against property: ₹51L–₹25 Cr, 3–15 years, from 9.5% p.a.
Professional loans: ₹1L–₹50L, from 9.99% p.a.
Also offers medical, equipment, and auto lease financing.
Breakout Stock 5 : Navin Fluorine International Ltd
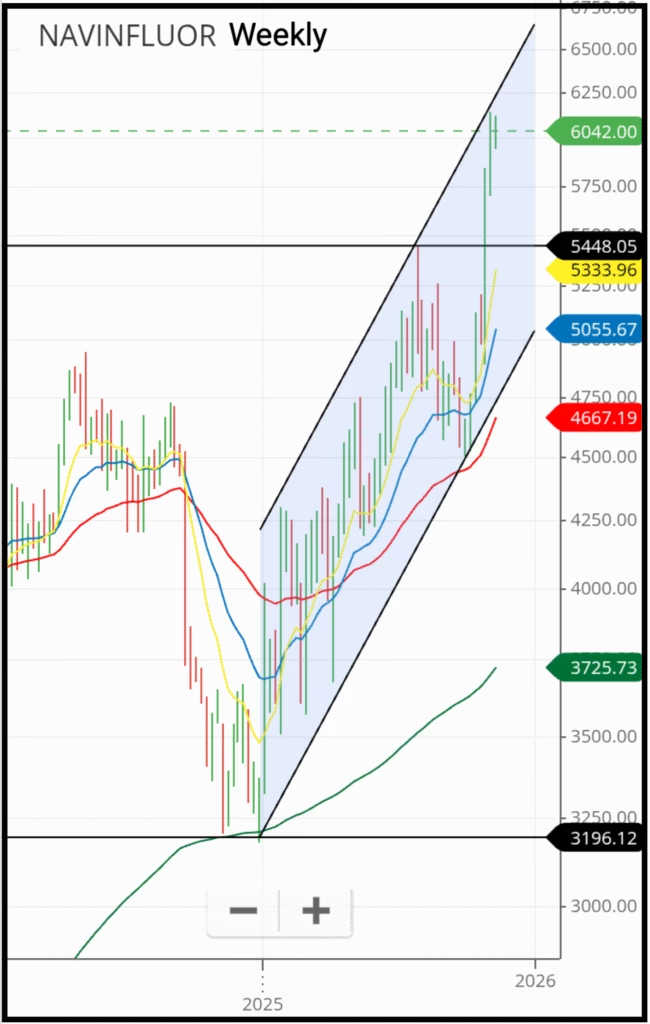
Chart Interpretation —
The above chart represents the Weekly Candlestick Chart of Navin Fluorine International Ltd. Price action is moving inside an uptrending channel, bounded by two ascending trendlines; the channel area is shaded in grey on the chart.
A breakout level is marked at ₹5448 (black horizontal line). The start of the short-term uptrend is marked at ₹3196.
Using the Fibonacci projection method, projection targets lie at 37.5%, 50%, 62.5% and 100%. The exact projection prices for this stock are shown in “Table 1 – Projection Levels of Breakout Stocks” above in this article.
Company Features
A Padmanabh Mafatlal Group company established in 1967, NFIL is a leader in specialty fluorochemicals, producing over 60 fluorinated compounds.
Business Overview:
Manufactures refrigerant gases, inorganic fluorides, specialty organofluorines, and provides contract research & manufacturing.
Applications span pharma, agrochemicals, aluminium smelting, metal processing, refrigeration, abrasives, glass, and ceramics.
Led by Vishad Mafatlal, a second-generation entrepreneur with 25+ years’ experience.
Breakout Stock 6 : HBL Engineering Ltd
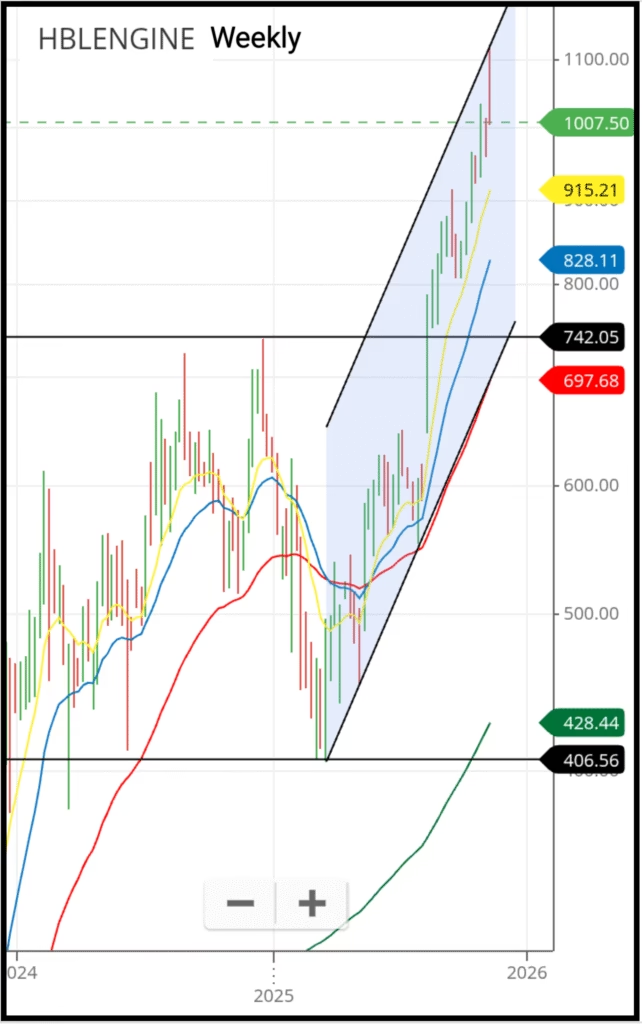
Chart Interpretation —
The above chart represents the Weekly Candlestick Chart of HBL Engineering Ltd. Price action is moving inside an uptrending channel, bounded by two ascending trendlines; the channel area is shaded in grey on the chart.
A breakout level is marked at ₹742 (black horizontal line). The start of the short-term uptrend is marked at ₹406.
Using the Fibonacci projection method, projection targets lie at 37.5%, 50%, 62.5% and 100%. The exact projection prices for this stock are shown in “Table 1 – Projection Levels of Breakout Stocks” above in this article.
Company Features
Founded in 1983, HBL is a diversified battery and electronics manufacturer catering to industrial, defence, and mobility sectors.
Business Segments:
- Industrial Batteries (71% of FY25 revenue):
Lead-acid (VRLA & PLT): Telecom, railways, UPS, defence.
Nickel-Cadmium: 2nd largest globally; strong export growth (40%).
Lithium-ion: 37% growth since FY23; supplies to Vande Bharat, Siemens Germany, and Indian Defence.
- Defence Systems (12% of FY25 revenue):
Batteries for aircraft, missiles, armoured & naval systems.
Develops Electronic Fuzes for grenades, artillery, and rockets.
Segment grew 24% (FY23–FY25).
- Industrial Electronics (15% of FY25 revenue):
Rail Signalling: Developed and certified Kavach v4.0; secured ₹4,000 Cr contracts covering 6,980 km of rail.
Train Management System (TMS): Installed 4 of 6 systems in India; scope expanding.
Electric Heavy Trucks: Developing 35T & 55T models; expected launch in Oct 2026.
Read More