
US stock market performance October 14, 2025
The US stock market experienced a mixed performance on Tuesday, October 14, 2025, marked by volatility driven primarily by renewed US-China trade tensions and and mixed corporate earnings reports.
Topics of Discussion
Review of Current US Stock Market
Here’s a snapshot of how the major indices closed:
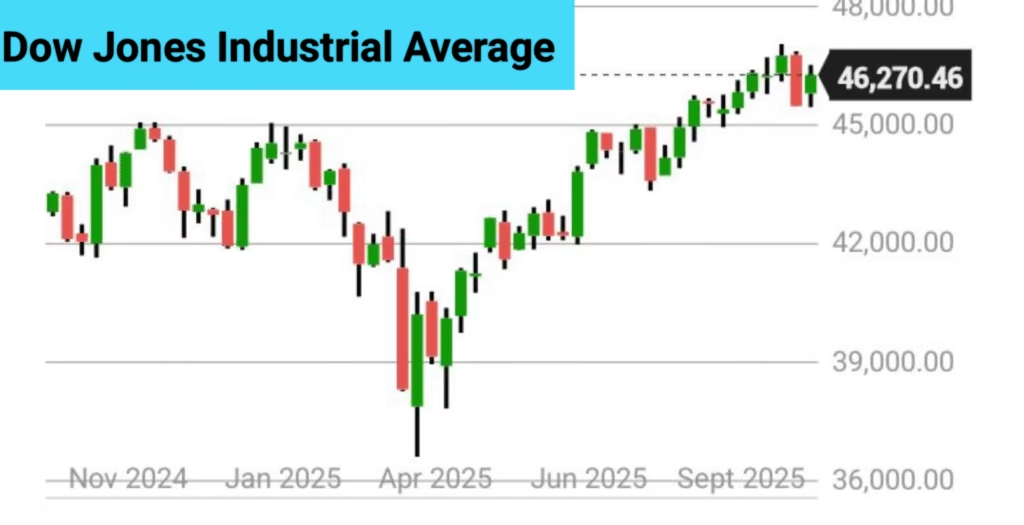
- The Dow Jones Industrial Average rose 0.44% to close at 46,270.46.
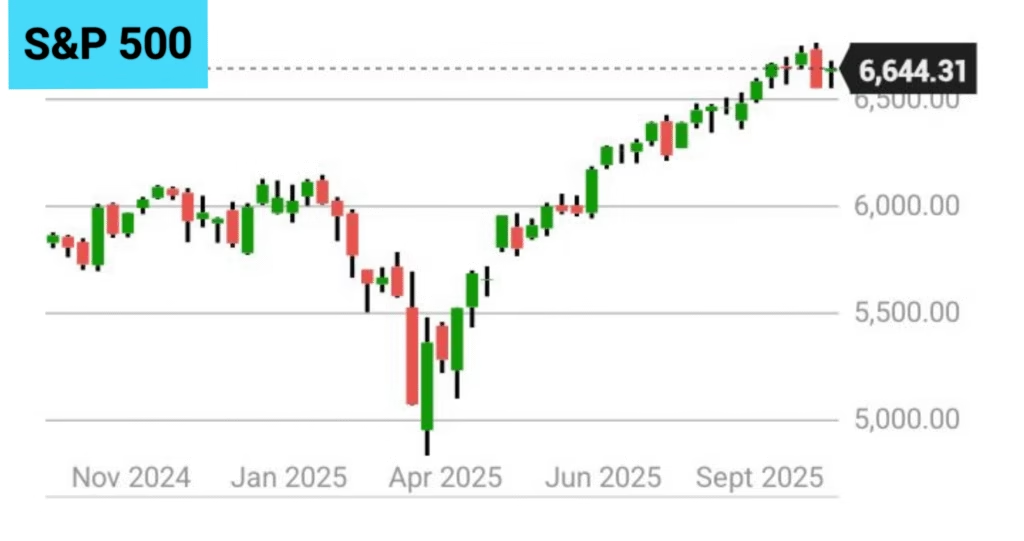
- The S&P 500 fell 0.16% to close at 6,644.31.
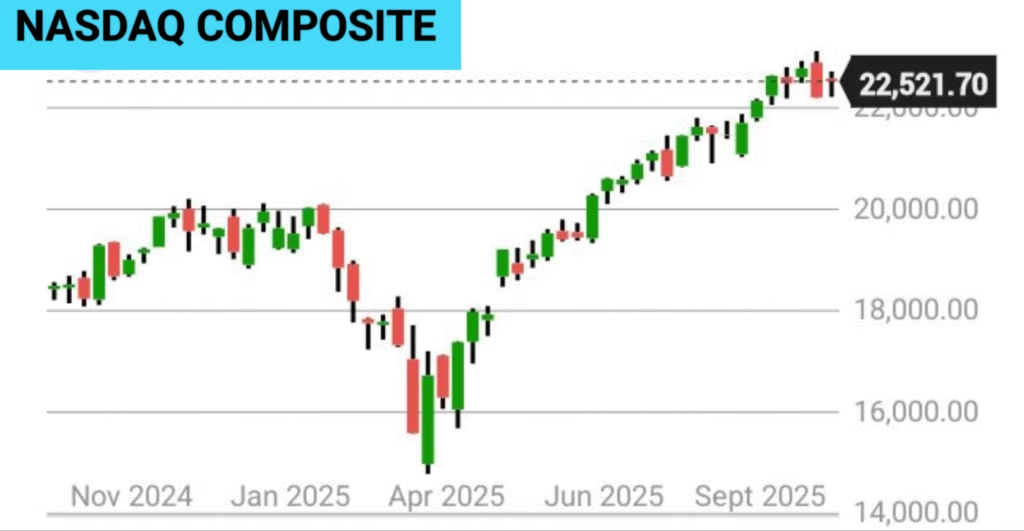
- The Nasdaq Composite declined 0.76% to close at 22,521.70.
Quick Review Table
| Index | Close | %Change |
| Dow Jones | 46270.46 | 0.44 |
| S&P500 | 6644.31 | –0.16 |
| Nasdaq | 22521.70 | –0.76 |
Key takeaways
- Trade Tensions: Renewed trade tensions between the US and China weighed heavily on investor sentiment, causing stock futures to drop and leading to a sell-off, particularly in technology and AI-focused stocks.
- Tech Sector Weakness: Shares of major tech companies such as Nvidia, Tesla, and Oracle declined significantly due to the heightened trade concerns.
- Positive Earnings: Despite the overall market downturn, some major banks and financial institutions, including JPMorgan Chase, Goldman Sachs, and Wells Fargo, reported stronger-than-expected third-quarter earnings. However, these positive earnings were not enough to counteract the negative sentiment caused by trade tensions.
- Safe-Haven Assets: Gold prices surged to new all-time highs, indicating a flight to safety as investors sought refuge from market uncertainty.
- Oil Prices: Crude oil prices fell by roughly 2%, reflecting concerns over a potential slowdown in demand due to geopolitical uncertainty.
Key Market Factors
- Geopolitical events like trade tensions significantly impact market stability and sentiment.
- Economic indicators and central bank decisions, such as interest rate adjustments, influence market trends.
- Corporate earnings reports and industry performance also play a crucial role in shaping market dynamics.
Also Read


Technical Analysis of US Stock Market Indices
Here is a technical overview of the Dow Jones Industrial Average, S&P 500, and Nasdaq Composite based on data up to October 14, 2025. Please note that technical analysis focuses on past price movements to predict future trends.
Dow Jones Industrial Average
Resistances and Supports Table
| Close | 46,270.46 |
| Resistances | Levels |
| 1 | 46408 |
| 2 | 46702 |
| 3 | 47010 |
| Supports | Levels |
| 1 | 45981 |
| 2 | 45518 |
| 3 | 45337 |
Moving Average Table
| Period (Days) | Simple | Exponential |
| 5 | 46155 | 46188 |
| 10 | 46379 | 46251 |
| 20 | 46298 | 46185 |
| 50 | 45603 | 46614 |
| 100 | 44543 | 44838 |
| 200 | 43421 | 43673 |
Oscillator Table
| Indicator | Vaue | Inference |
| RSI(14) | 53.31 | Neutral |
| Stoch (9,6) | 97.79 | Overbought |
| MACD (12,26) | 181.21 | Buy |
| ADX | 25.27 | Sell |
Insights
- Current Price: 46,270.46 as of October 14, 2025.
- Key Resistance: Resistance levels are observed at 46,408 and 46,702. A sustained move above 46,702 could open the door for a rally towards 47,010.
- Key Support: The primary support level is in the 46,000-45,900 range. A break below this support could lead to a decline towards 45,700-45,500, potentially challenging the 45,000 mark in the near term.
- Recent Performance: The Dow showed a strong bounce on October 13, rising 1.29%, but then fell 1.1% on October 14.
- Technical Indicators: The current trend is strongly bullish, supported by moving averages, but caution is advised due to overbought conditions indicated by the Stochastic indicators and ADX is showing sell signal, potentially signaling a short-term correction.
Also Read


S&P 500
Resistances and Supports Table
| Close | 6644.31 |
| Resistances | Levels |
| 1 | 6696 |
| 2 | 6755 |
| 3 | 6810 |
| Supports | Levels |
| 1 | 6590 |
| 2 | 6551 |
| 3 | 6489 |
Moving Average Table
| Period (Days) | Simple | Exponential |
| 5 | 6668 | 6658 |
| 10 | 6693 | 6670 |
| 20 | 6671 | 6649 |
| 50 | 6544 | 6542 |
| 100 | 6342 | 6376 |
| 200 | 6055 | 6133 |
Oscillator Table
| Indicator | Vaue | Inference |
| RSI(14) | 51.47 | Neutral |
| Stoch (9,6) | 58.48 | Buy |
| MACD (12,26) | 37.4 | Buy |
| ADX | 33.00 | Sell |
Insights
- Current Price: 6,644.31 as of October 14, 2025.
- Key Resistance: Resistance is identified in the 6,696-6,755 area. A break above 6755 could signal further gains towards 6810.
- Key Support: Failure to breach the resistance levels could lead to a decline towards 6,590. A break below 6,590 would increase selling pressure, potentially pushing the index down to 6,551- 6489.
- Trading Range: The index is currently experiencing an unclear immediate outlook, likely trading within a range of 6,590-6,696. A breakout from this range is crucial to determine the next significant move.
- Recent Performance: The S&P 500 recovered 1.56% on October 13 but then experienced a drop of 1.3% on October 14.
- Technical Indicators: The current trend is strongly bullish, supported by moving averages, but caution is advised due to overbought conditions indicated by the Stochastic indicators, potentially signaling a short-term correction.
Also Read


Nasdaq Composite
Resistances and Supports Table
| Close | 22521.70 |
| Resistances | Levels |
| 1 | 22818 |
| 2 | 23000 |
| 3 | 23448 |
| Supports | Levels |
| 1 | 21891 |
| 2 | 21579 |
| 3 | 20964 |
Moving Average Table
| Period (Days) | Simple | Exponential |
| 5 | 22698 | 22633 |
| 10 | 22760 | 22675 |
| 20 | 22647 | 22542 |
| 50 | 22018 | 22016 |
| 100 | 21076 | 21234 |
| 200 | 19753 | 20143 |
Oscillator Table
| Indicator | Vaue | Inference |
| RSI(14) | 51.60 | Neutral |
| Stoch (9,6) | 96.9 | Overbought |
| MACD (12,26) | 201.2 | Buy |
| ADX | 30.73 | Sell |
Insights
- Current Price: 22,521.70
- Key Resistance: Strong resistance levels are noted at 22,818 and 23,000 Overcoming 23,818 and subsequently 23,000 is necessary to alleviate downside pressure and potentially target the 23,448 level.
- Key Support: Failure to breach the resistance levels could lead to a decline towards 21,891. A break below 21,891 would increase selling pressure, potentially pushing the index down to 21,579.
- Recent Performance: The Nasdaq Composite surged 2.21% on October 13 but then fell nearly 2% on October 14.
- Technical Indicators: The current trend is strongly bullish, supported by moving averages, but caution is advised due to ADX showing a sell signal, potentially signaling a short-term correction.
Important considerations
- Follow-Through Buying: A crucial factor for all three indices is the need for strong follow-through buying to maintain upward momentum and avoid falling back again.
- Geopolitical and Economic Factors: Renewed US-China trade tensions significantly impacted the market on October 14. Ongoing earnings season and Federal Reserve policies will also likely influence future market movements
Key Factors that Affects the Performance Of US Stock Market
Macroeconomic conditions, monetary policy, political and geopolitical events, and investor sentiment are among the key factors that affect the US stock market. These factors influence investor confidence and corporate profitability, which in turn drive stock prices.
Macroeconomic Factors
- Gross Domestic Product (GDP): A strong GDP, which measures the total value of goods and services produced, indicates a healthy economy and tends to boost stock prices. A weak or falling GDP can signal an economic downturn and cause the market to decline.
- Inflation: High inflation can negatively impact the stock market by eroding purchasing power, increasing costs for businesses, and prompting the Federal Reserve to raise interest rates.
- Unemployment Rate: A low unemployment rate generally signals a strong economy with high consumer spending, which is positive for corporate earnings and stock prices.
- Industrial Production: The Industrial Production Index (IPI), released by the Federal Reserve, offers insights into the strength of the manufacturing, mining, and utility sectors. Healthy industrial output generally indicates a strong economy.
- Retail Sales: High retail sales reflect strong consumer demand, a key driver of the US economy, and are typically a positive indicator for the stock market.
- Exchange Rates: The value of the US dollar affects multinational corporations. A strong dollar can negatively impact companies with significant international revenues.
Monetary Policy
- Interest Rates: Controlled by the Federal Reserve, interest rate changes are a primary driver of the market. Higher rates make borrowing more expensive for businesses and can make alternative investments like bonds more attractive, negatively impacting stock prices. Conversely, lower rates can stimulate economic activity and boost stock prices.
- Federal Reserve Actions: The Fed’s decisions and forward guidance on rates and other policies, including quantitative easing and tightening, heavily influence market expectations and volatility.
Political and Geopolitical Events
- Government Policies and Stability: Decisions on taxation, regulation, and fiscal policies can significantly affect businesses and investor confidence. Political instability can create uncertainty and lead to market volatility.
- Trade Wars and Tariffs: Tensions between the US and other countries, such as China, can trigger market volatility by increasing costs and creating uncertainty about global supply chains and economic growth.
- Global Events and Conflicts: Major events like pandemics, wars, and international crises can disrupt supply chains, alter consumer behavior, and create global uncertainty that affects the US market.
Investor sentiment
- Fear and Greed: Market sentiment is driven by the collective optimism or pessimism of investors. Positive sentiment can drive demand and push prices higher, while negative sentiment can lead to selling pressure and market declines.
- Earnings Reports: Investor expectations regarding corporate earnings reports play a major role. Strong earnings can boost confidence, but disappointing results can trigger sell-offs, even for companies with strong growth.
- Speculation and Trends: Trends like the AI boom or shifts in investment towards certain sectors or asset classes can create rapid market movements and concerns about overvaluation.
Conclusion
The overall outlook for the US stock market remains bullish, driven by strong technical indicators and sustained buying pressure across the Dow Jones, Nasdaq Composite, and S&P 500. However, the ADX’s sell signal hints at a possible short-term correction, suggesting that traders should remain vigilant. The market’s next direction will largely depend on follow-through buying momentum, as well as evolving geopolitical factors, including US–China trade tensions, and the outcomes of the ongoing earnings season and Federal Reserve policy decisions. Staying cautious yet optimistic is the key as the market navigates these influences.
Frequently Asked Questions (FAQ)
What is the current outlook for the US stock market on 15th October 2025?
The US stock market shows a mixed to bullish trend, with the Dow Jones, Nasdaq, and S&P 500 experiencing moderate gains. Technical indicators suggest a continuation of upward momentum, but short-term corrections are possible due to market volatility and geopolitical factors.
Which factors are influencing the US stock market right now?
Key factors include Federal Reserve policies, interest rate changes, inflation data, geopolitical tensions, and corporate earnings. Additionally, global economic conditions and investor sentiment impact market performance.
How are the Dow Jones, Nasdaq, and S&P 500 performing technically?
Technical analysis indicates that moving averages, RSI, and MACD signals suggest bullish trends in the Dow and S&P 500, while Nasdaq shows moderate momentum. Short-term corrections may occur in response to high volatility or global events.
What are the potential risks for US investors in the short term?
Risks include unexpected geopolitical events, policy changes from the Federal Reserve, rising inflation, or sharp corrections in tech-heavy indices like Nasdaq. Investors should monitor market indicators and maintain a balanced portfolio.
How can traders use this outlook for decision-making?
Traders can use the technical analysis, market trends, and economic factors highlighted in the report to make informed decisions. Strategies include monitoring support and resistance levels, sector performance, and macroeconomic news for short-term trades.
Where can I find updates on future US stock market outlooks?
Future updates are published regularly on Smart Investello Research and Analysis, covering daily and weekly analysis of Dow Jones, Nasdaq, S&P 500, and sector-specific trends. Subscribing to alerts ensures you receive the latest insights for better investment decisions.
Disclaimer
The information provided is for educational and informational purposes only and should not be considered financial or investment advice. Market conditions can change rapidly, and investors are encouraged to perform their own technical and fundamental analysis or consult a qualified financial advisor before making any investment decisions.