
Market Overview
Details for Nifty and Sensex from yesterday, October 8th, 2025:
- The Nifty 50 opened at 25,079.75 and closed at 25,046.15. It reached a high of 25,192.5 and a low of 25,008.5.
- The Sensex opened at 81,899.51 and closed at 81,773.66. It reached a high of 82,257.74 and a low of 81,646.08.
Topics of Discussion
Key Market Updates for Yesterday
- Both the Sensex and Nifty snapped a four-day winning streak, with profit booking observed at higher levels.
- The Nifty managed to hold above the 25,000 level despite closing in the red, while broader markets saw a larger decline compared to the benchmarks.
- Large-cap IT stocks showed some buying interest ahead of upcoming earnings reports, such as TCS.
- Some factors contributing to the market’s activity included Foreign Institutional Investor (FII) buying earlier in the week, strength in IT stocks ahead of TCS results, and global cues like remarks from a Federal Reserve Governor on potential interest rate cuts in the US.
Key Factors Affecting Nifty 50 Performance
The performance of the Nifty 50 is influenced by a complex interplay of various factors, encompassing economic indicators, government actions, global events, and market-specific dynamics.
Economic Indicators:
- Government Policies & Regulations:
- Monetary Policy (RBI): Decisions by the Reserve Bank of India (RBI) regarding interest rates (Repo/Reverse Repo rates) and liquidity management directly impact the cost of borrowing for companies and the flow of money into the market.
- Fiscal Policies & Budget Announcements: Government policies on taxation, regulations, and spending can affect business profits, investor sentiment, and sectoral performance.
- Regulatory Policies (SEBI): Changes in trading and investment regulations by SEBI can influence market activities and stock prices.
- Global Factors:
- Geopolitical Events: Conflicts, trade tensions (like US tariff policies), and global economic crises can create uncertainty and impact investor sentiment.
- Crude Oil Prices: Fluctuations in crude oil prices can affect sectors reliant on imports, impacting corporate profits and stock prices. Some studies suggest a positive effect in a global economic turnaround, while others note a negative effect due to inflation.
- Foreign Institutional Investment (FII) Flows: Inflows of foreign capital can boost demand and stock prices, while significant outflows can create selling pressure.
Market Dynamics
- Corporate Earnings & Performance: Strong quarterly earnings reports from Nifty 50 companies can drive up share prices, while disappointing results can lead to declines.
- Investor Sentiment: Sentiment, driven by news, rumors, or analyst reports, significantly impacts stock prices, leading to volatility.
- Sector Performance: Trends within specific industries or sectors (e.g., IT, Banking, Auto) can influence the performance of stocks within those sectors and the overall Nifty 50.
- Supply and Demand Dynamics: The basic economic principle where higher demand than supply drives prices up, and vice versa. Large trades by institutional investors can significantly impact this balance.
Recent Influences on the Nifty 50
- The Nifty 50 recently experienced a downturn due to profit-taking, weak global trends, and pressures in the banking and real estate sectors.
- Despite this, some sectors like IT showed resilience, partly due to strong demand and appealing valuations, with upcoming earnings reports like TCS being a focus.
- Higher US bond yields and a stronger US dollar have contributed to FII selling in the Indian market.
- Domestic strength from robust consumption, RBI policy interventions, and government initiatives continue to attract long-term investments.
Also Read


Technical Analysis: Nifty 50 Prediction Overview
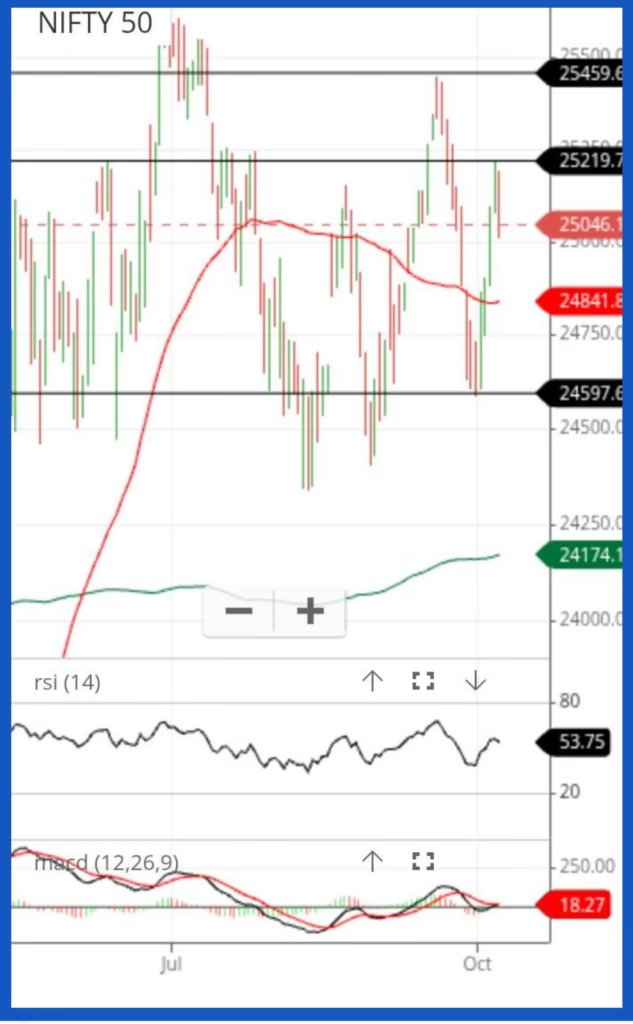
Chart Type & Time Frame
Type: Candlestick chart
Time Frame: 1 Day (each candle represents one trading day)
Index: NIFTY 50
So, each green or red bar (candle) shows the price movement of NIFTY for one day.
Candlesticks
Green candle = Price closed higher than it opened (bullish day).
Red candle = Price closed lower than it opened (bearish day).
The wicks (thin lines) show day’s high and low, while the body shows open and close.
Moving Averages (Red and Green Lines)
You have two moving averages here:
Red line – 50-day moving average (MA50) (medium-term trend).
Green line – 200-day moving average (MA200) (long-term trend).
Interpretation:
Price Above MA50 → Intermediate-term trend is strong.
Price above MA200→ Long-term strength strong.
Crossovers matter:
When red line (MA50) crosses below green (MA200), it’s a bearish crossover (Death Cross).
When red line crosses above green, it’s a bullish crossover (Golden Cross).
Currently, the red MA50 is above the green MA200, but price is fluctuating near it, indicating strength.
Support and Resistance Levels
The black horizontal lines are key support/resistance zones:
Level Type Meaning
25459 Resistance Strong supply zone – price previously fell from here.
25219 Resistance Near-term hurdle; price struggling to cross this.
24597 Support Buyers have defended this level before.
24174 Major Support Long-term floor; if broken, could trigger a deeper correction.
Currently, price is around 25046, just below resistance (25219) — so there’s selling pressure near that area.
RSI (Relative Strength Index – middle panel)
Indicator below the main chart.
RSI = 53.75 (neutral zone).
Range meaning:
Above 70 = Overbought → Possible correction.
Below 30 = Oversold → Possible bounce.
Around 50 = Neutral → Consolidation or sideways market.
👉 Interpretation: Nifty is neither overbought nor oversold. Momentum is balanced.
MACD (Moving Average Convergence Divergence – bottom panel)
Two lines (black and red) and histogram bars.
Black line = MACD line
Red line = Signal line
Reading:
MACD > Signal line → Bullish momentum.
MACD < Signal line → Bearish momentum.
Histogram (green/red bars) shows momentum strength.
Currently, both lines are very close — momentum is gaining strength as crossover is observed.
🔎 7. Overall Technical View
Aspect Observation Meaning
Price vs MA50 Slightly bullish
RSI Neutral (53) Sideways momentum
MACD Flat, near zero gaining momentum
Key Support 24597 If broken → deeper fall possible
Key Resistance 25219 Needs breakout for bullish confirmation
In Simple Words
Nifty 50 is currently trapped between 24600 (support) and 25200 (resistance).
RSI and MACD both show neutral momentum — no strong trend.
If Nifty closes above 25219, it could target 25459+.
If it breaks below 24597, it could test 24174.
Insights from the Chart (Bullish Bias):
Despite recent volatility, the Nifty 50 is showing early signs of regaining strength. The index has successfully held above the crucial 24,600 support zone and is now attempting to reclaim the 25,000 mark. RSI remains comfortably above the midpoint at 53, indicating that buying momentum is gradually building without entering overbought territory. The MACD, though still flat, is on the verge of a positive crossover — a sign that bullish momentum could soon pick up.
If Nifty manages a decisive close above 25,219, it would confirm a short-term breakout, opening the path toward 25,460–25,500 levels. The overall structure suggests a base formation near 24,600, and as long as this support holds, the broader trend remains positive. Dips toward the 24,800–24,850 range can be seen as healthy retracements and potential buying opportunities for medium-term investors.
Also Read


Predictions of Other Analysts:
Predictions for the Nifty 50 vary across different timeframes based on various analyses and expert opinions.
Long-Term (1-10+ years)
- Overall Outlook: The long-term outlook for Nifty 50 is generally positive, driven by India’s robust economic growth potential, young population, expanding middle class, and digitalization efforts.
- Key Factors: Growth in sectors like technology, manufacturing, infrastructure, and financial services, alongside government initiatives and foreign investment inflows, are expected to fuel this growth.
- Potential Targets: Some analyses suggest Nifty could reach 90,000–100,000 by 2030. Other predictions estimate Nifty reaching 60,000 by 2033.
- Composition Changes: The Nifty’s composition is expected to evolve, with new sectors like advanced technology and digital players potentially joining or consolidating existing industries like banking, energy, and IT.
Intermediate-Term (3-6 months)
- Axis Securities: Forecasts Nifty 50 to reach 25,500 by March 2026.
- JPMorgan: Expects Nifty 50 to trade between 26,500 and 30,000 over the next nine months.
- Motilal Oswal: Sees a 26,000 target for March 2026.
- Contrarian Indicator (FII Positioning): Suggests a possible 6-8% rebound in Nifty over the next 3-6 months if Foreign Institutional Investor (FII) index futures positioning remains near peak short levels.
- Technical Analysis:
- Centrum Broking Ltd: Predicts a rally towards 25,500 in the October series if Nifty sustains above 25,020.
- Hedged.in: Notes bullishness with Nifty closing above the Bollinger band middle line and suggests movement towards 25,330.
Short-Term (Today, Tomorrow, This Week)
- Latest Closing (October 8th, 2025): The Nifty 50 closed at 25,046.15.
- Today’s Outlook (October 9th, 2025): The immediate bias for Nifty is positive, with potential for consolidation.
- Key Levels:
- Support: 25,000 is considered a major support level.
- Resistance: Immediate resistance is seen at 25,150 to 25,200.
- Market Action: Trading above 25,000 could unlock fresh upside, potentially towards 25,200 to 25,300. Buying on dips, particularly towards 24,600, is suggested. Avoid short positions above 25,000.
- Technical Indicators (as of October 9th, 2025, 5 hours old):
- RSI(14) is neutral at 49.886.
- STOCH(9,6) is overbought at 98.96.
- MACD(12,26) and ADX(14) are in ‘Buy’ action.
Conclusion:
Technically nifty is in strong position despite negative sentiment due to government announcements and global policies.
Disclaimer
The information shared on Smart Investello Research and Analysis (SIRA) is intended solely for educational and informational purposes. All articles, charts, analyses, and calculators published here reflect research-backed insights and personal opinions aimed at improving financial awareness among readers.
SIRA does not provide personalized investment advice or recommend buying, selling, or holding any particular stock, mutual fund, or financial instrument. The content is designed to help readers understand Systematic Investment Plans (SIPs), mutual funds, and stock market trends more effectively, not to serve as a substitute for professional financial consultation.
Investing in equity, mutual funds, or any market-linked product involves market risks, including potential loss of capital. Readers are strongly advised to verify all information independently and consult a SEBI-registered financial advisor before making any investment decisions.
SIRA and its authors will not be liable for any financial loss, damage, or inconvenience arising directly or indirectly from the use of the information provided on this website.