
Stock Market Prediction – Nifty 50, Nifty Midcap, Nifty Smallcap and Sectors
The Stock Market Prediction for 21 October 2025 presents a comprehensive overview of the Indian equity market through detailed technical analysis and multi-index chart interpretation. This analysis begins with the Nifty 50, offering insights into crucial support and resistance levels, trend momentum, and short-term directional bias. Following this, dedicated sections cover the Midcap and Smallcap indices — two segments that often signal broader market strength or weakness ahead of large-cap movements.
In addition to index-level analysis, this report includes a breakdown of 19 major sectors, with focused chart insights on 8 key sectors that currently show wide market participation and influence — such as Banking, IT, Energy, FMCG, Auto, Metal, Pharma, and Realty. Each sector is examined for its short-term structure, price behavior, and correlation with the overall Nifty 50 trend. The combined view helps identify whether strength lies in frontline stocks or if rotational buying is visible in broader segments.
From Nifty 50 charts and insights to Midcap and Smallcap technical overviews, and finally to sectoral chart analysis, this prediction aims to deliver a clear market roadmap for traders and investors ahead of 21 Oct 2025. The data-driven interpretation of supports, resistances, and momentum signals will assist readers in understanding where opportunities and risks may arise across indices and sectors in the upcoming trading session.
Topics of Discussion
Technical Analysis
Technical Analysis of Nifty and Bank Nifty
Rewritten Version:
Detailed technical analysis of Nifty 50 across short-, intermediate-, and long-term trends, along with an in-depth Bank Nifty analysis, has already been covered in the articles and cards linked below. To avoid repetition, this post focuses on the Nifty Midcap, Nifty Smallcap, and other sectoral indices to highlight emerging trends and market behavior beyond the benchmark indices.


Nifty Midcap150:
Chart Pattern in Weekly Chart:
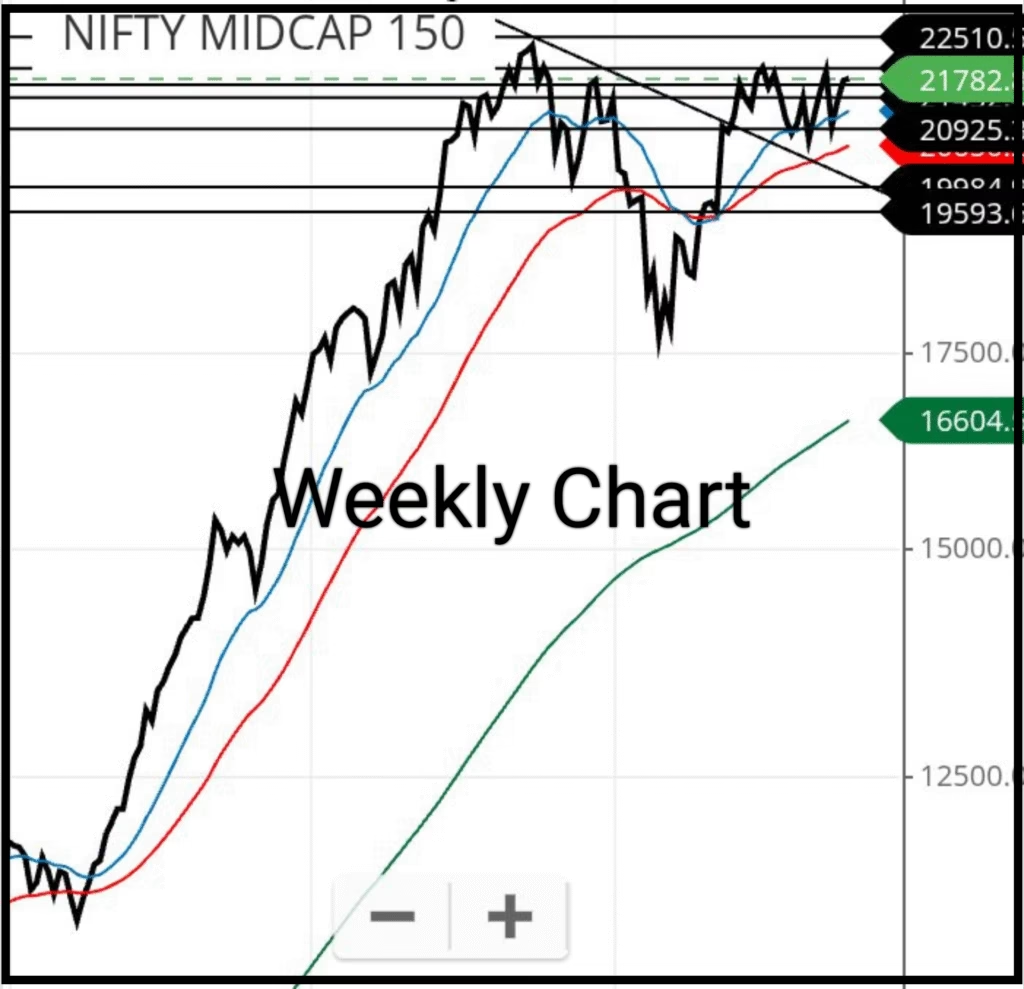
Chart Pattern: Inverted Head and Shoulder pattern
The index is currently forming an inverted head and shoulders pattern, a classic bullish reversal signal. If Nifty Midcap 150 successfully crosses the 22510 level, it could trigger a long-term bull run.
Trend Line Analysis:
The index has broken the trendline drawn from its all-time high, followed by a short-term pullback. This breakout suggests that Nifty Midcap 150 is primed for a sustained upward movement.
Support and Resistance Levels:
Key support and resistance levels will be analyzed in detail in the daily chart section below.
Daily Chart of Nifty Midcap150:
Inference from Nifty Midcap 150 Chart
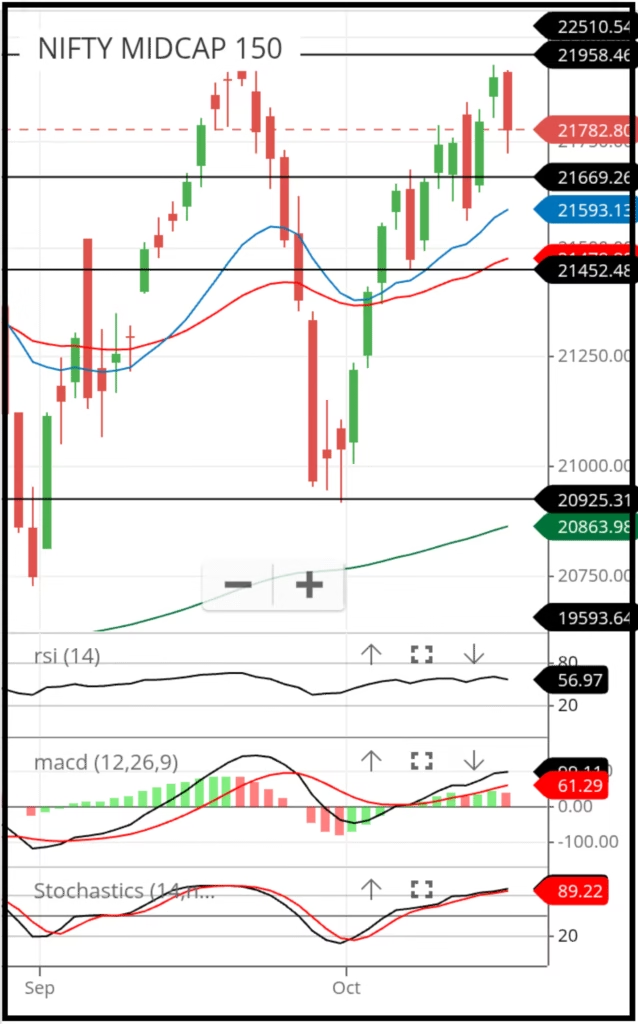
Candlestick Chart Analysis
The candlestick chart of Nifty Midcap 150 indicates that the ongoing uptrend began from 20,925 and extended to 21,782, marking a gain of 857 points, or approximately 4.10%, within just 12 trading sessions. This sharp rise within a short duration highlights growing market momentum and the potential onset of a strong bull run.
Moving Averages and Divergence
The index is currently trading above all three key exponential moving averages (EMAs) — the 20-day, 50-day, and 200-day — which are all showing positive divergence, reinforcing the bullish sentiment in the Midcap space.
20-day EMA: 21,593.10
50-day EMA: 21,500.20
200-day EMA: 20,863.98
These moving averages are acting as dynamic support zones, suggesting strength and stability in the prevailing uptrend. The alignment of short-, medium-, and long-term EMAs in ascending order is a classic sign of bullish bias in the market.
Resistance Breakouts
Over the past 12 trading sessions, Nifty Midcap 150 has consecutively breached key resistance levels at 21,452, 21,669, and the psychological mark of 21,000.
The next resistance hurdles are positioned at:
21,958
22,000 (psychological level)
22,510, which coincides with the horizontal resistance from the all-time high.
A sustained move above these levels could confirm further upside momentum.
Support Zones
Immediate support levels are identified at 21,669, 21,452–21,500 (psychological zone), and the broader 20,952–21,000 range. These levels may offer buy-on-dips opportunities for traders looking to participate in the ongoing trend.
Resistance and Support Levels of Nifty Midcap 150
| Resistance | Support |
| 21,958 | 21,669 |
| 21,000 | 21,452 |
| 21,510 | 21,000 |
Relative Strength Index (RSI)
The RSI currently stands at 56.97, indicating a healthy uptrend with room for further upside. It supports the view that the rally can continue without yet entering overbought territory.
Stochastic Indicator
The Stochastic Oscillator is in the overbought zone at 89.22, which often provides false reversal signals during strong bull runs. Traders are therefore advised to remain cautious and maintain strict stop-loss levels while holding long positions in the current setup.
MACD Indicator
On the daily chart, the MACD remains above the zero line, with a value of 100.21, and is trading above the signal (red) line. This confirms that the intermediate-term bullish trend is intact, and momentum continues to favor the upside.
Technical Insights
The short-term and intermediate-term trends of the Nifty Midcap 150 remain decisively bullish. However, a mild price correction would be healthy for the market, offering an opportunity to accumulate quality midcap stocks on dips.
Traders should avoid aggressive short-term positions and adopt a disciplined approach with strict stop-loss placement to manage volatility during this phase of the rally.
Create Your Own System of Technical Analysis
Technical analysis can be approached in many ways, and every trader eventually develops a method that suits their style and comfort. The approach described above is how I personally conduct my analysis.
When drawing horizontal support or resistance lines, always ask yourself: “Does this line touch any significant high or low?” — if the answer is yes, you’re likely identifying a valid level.
Similarly, when plotting trend lines, connect major highs to major highs for a downtrend and major lows to major lows for an uptrend. Accuracy in these connections often determines the reliability of your analysis.
In my charts, I use three indicators and three exponential moving averages, which together provide a balanced and accurate picture of market momentum. Although there are hundreds of indicators available, it’s advisable to work with three to five that you understand well. Avoid overcrowding your chart — because ultimately, all analysis leads to just one decision: BUY or SELL.
From the next section onward, I will share insights on specific sectors or indices, focusing primarily on key support and resistance levels, while encouraging readers to build their own system of analysis based on observation and practice.
Nifty Smallcap 250
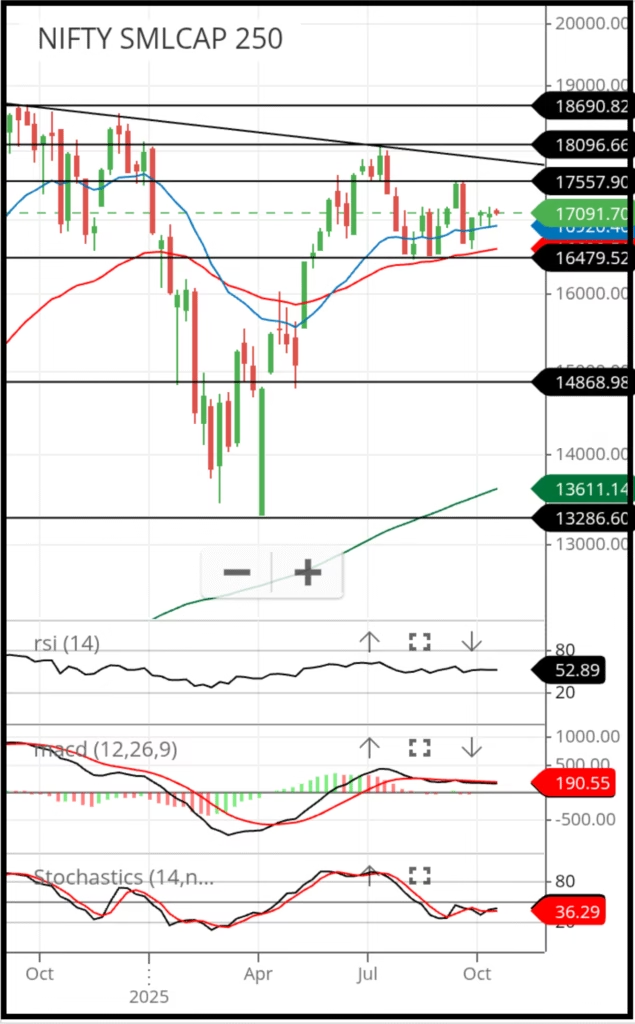
Insights on Nifty Smallcap 250
A comparative analysis of Nifty 50, Nifty Midcap 150, and Nifty Smallcap 250 across different time frames reveals a consistent pattern — smallcaps usually begin their bull runs later than large and midcaps and tend to lose momentum earlier. However, volatility in smallcaps remains considerably higher, often resulting in sharper price swings within shorter durations.
At present, the Nifty Smallcap 250 is consolidating within a trading range between 16,479 and 18,096. A breakout on either side of this range will determine the next major directional move. Both the 20-day and 50-day exponential moving averages are flat to slightly upward, confirming that the index is currently moving sideways.
Momentum indicators also support this view — the RSI at 52 and Stochastic at 36 reflect neutral market conditions, while the MACD and its signal line continue to move flat, showing a lack of strong momentum in either direction.
➡️ The detailed support and resistance levels of Nifty Smallcap 250 are provided in the table below.
Resistance and Support Levels of Nifty Smallcap 250
| Resistance | Support |
| 17,557 | 16479 |
| 18,096 | 15,990 |
| 18,690 | 15953 |
Given these technical observations, traders are advised to remain cautious and avoid aggressive short-term positions in the Smallcap segment. Focus should instead be on Largecap and Midcap indices, where trend clarity and directional strength are more visible.
Nifty IT(Information Technology)
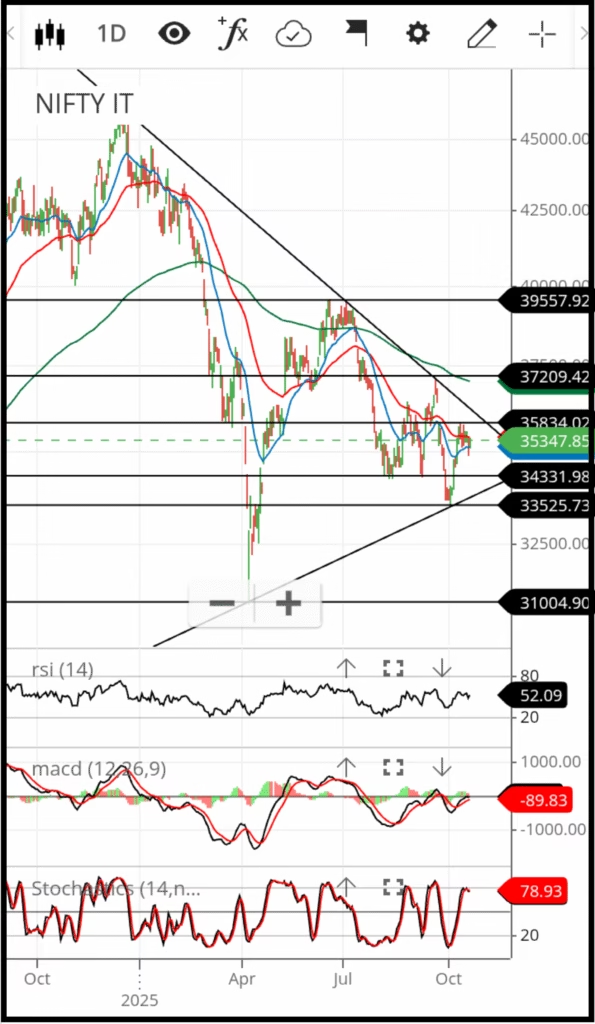
Inference from Nifty IT Daily Chart
The short-term and intermediate-term trends of Nifty IT currently remain downward. A triangle pattern is visible on the daily chart, indicating a phase of consolidation. However, a clear trend direction can only be confirmed once the price breaks decisively above or below this triangular formation.
At present, the index is trading below the 20-day and 50-day exponential moving averages (EMAs), reflecting weakness and a lack of buying momentum. The MACD remains in negative territory with a value of –89.83, confirming that the intermediate trend continues to favor the downside. Meanwhile, the RSI at 52 suggests limited price movement and an absence of strong momentum in either direction.
The Stochastic oscillator is approaching the overbought zone at 78, which may indicate a potential short-term pullback if selling pressure resumes.
Given these conditions, traders are advised to avoid initiating long positions in the Nifty IT index at this stage. Instead, short-selling opportunities may be considered near resistance levels — but only with a strict stop-loss to manage risk.
➡️ The detailed intermediate Term support and resistance levels are provided in the table below.
Resistance and Support Levels of Nifty IT
| Resistance | Support |
| 35,834 | 34,332 |
| 37,209 | 33,525 |
| 39,557 | 31,004 |
Nifty FMCG, NIFTY Pharma and Nifty Auto
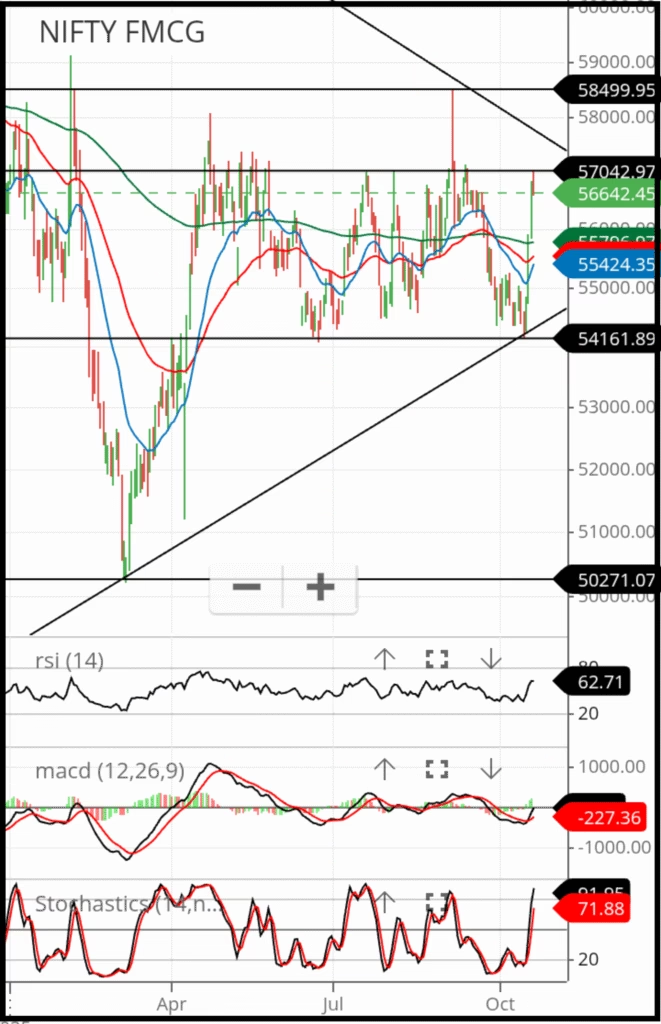
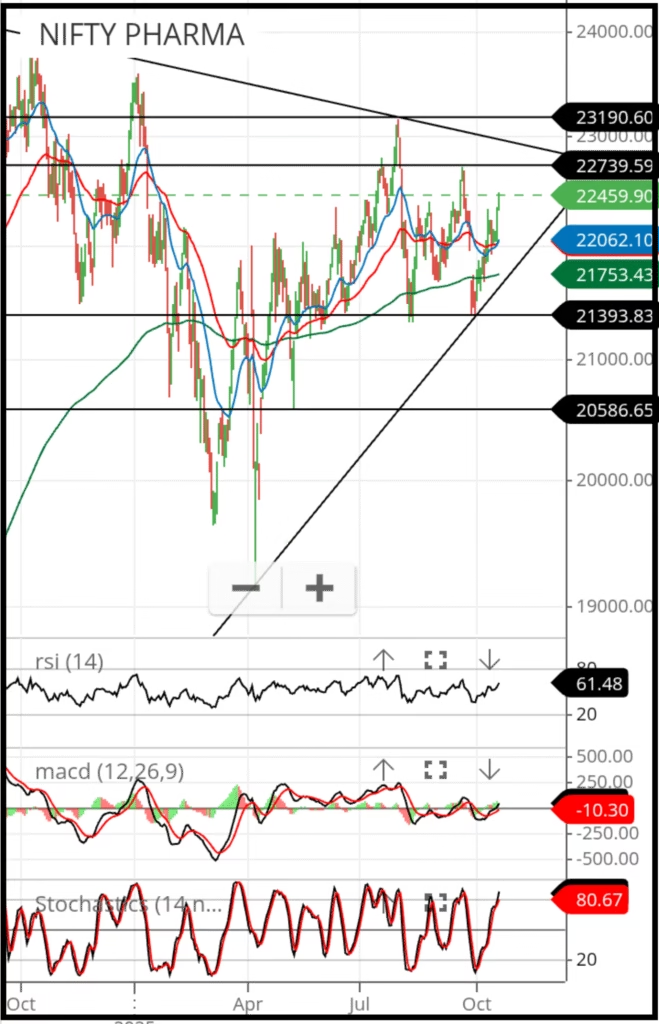
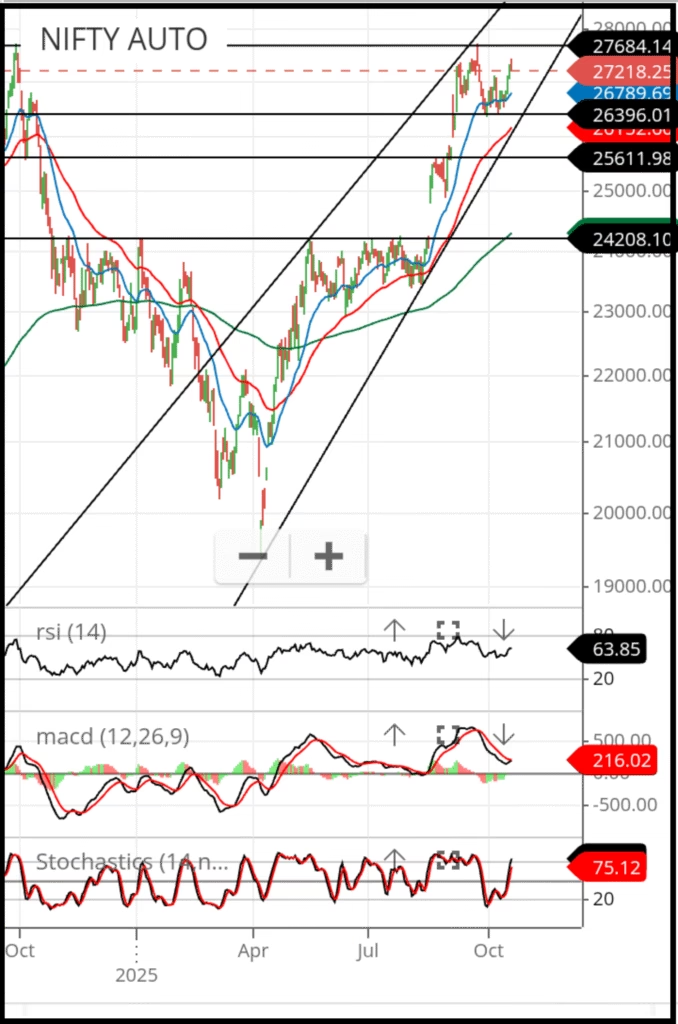
Above Three Chart: Source Zerodha Kite
Inference on Nifty FMCG, Nifty Pharma, and Nifty Auto
Nifty FMCG
The Nifty FMCG index is currently trading between a resistance level of 57,042 and a support level of 54,161. The index is also forming a triangle pattern, suggesting a phase of consolidation. A breakout or breakdown from this triangle will determine the next directional move. Given the wide gap between support and resistance, traders may consider buying near the support line and booking profits close to the resistance zone until a clear trend emerges.
Nifty Pharma
The Nifty Pharma index reflects a similar setup to FMCG, remaining range-bound with limited directional cues. The key support level is at 21,393, while resistance is seen at 22,739. Traders may adopt a buy-on-dips and sell-on-rise approach within this range until a decisive breakout signals a trend shift.
Nifty Auto
In contrast, the Nifty Auto index continues to exhibit strong bullish momentum. Both the intermediate and short-term trends are firmly upward, with the index moving within a well-defined ascending channel. However, traders should remain cautious near the resistance zone around 21,784, where short-term profit booking or consolidation could occur before the next leg of the rally.
Nifty Metal, Nifty Realty and Nifty Energy
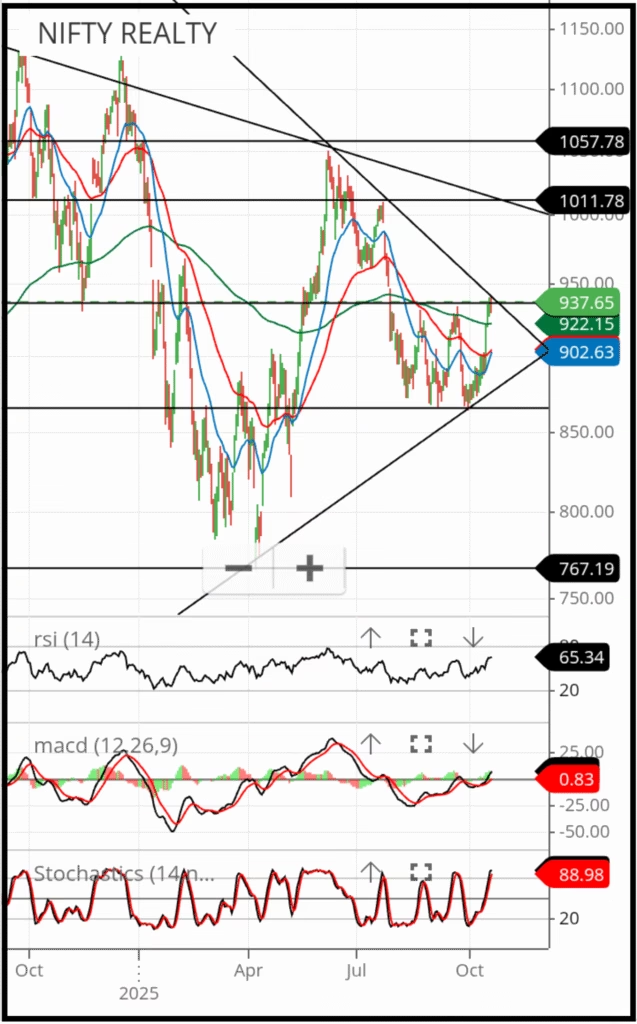
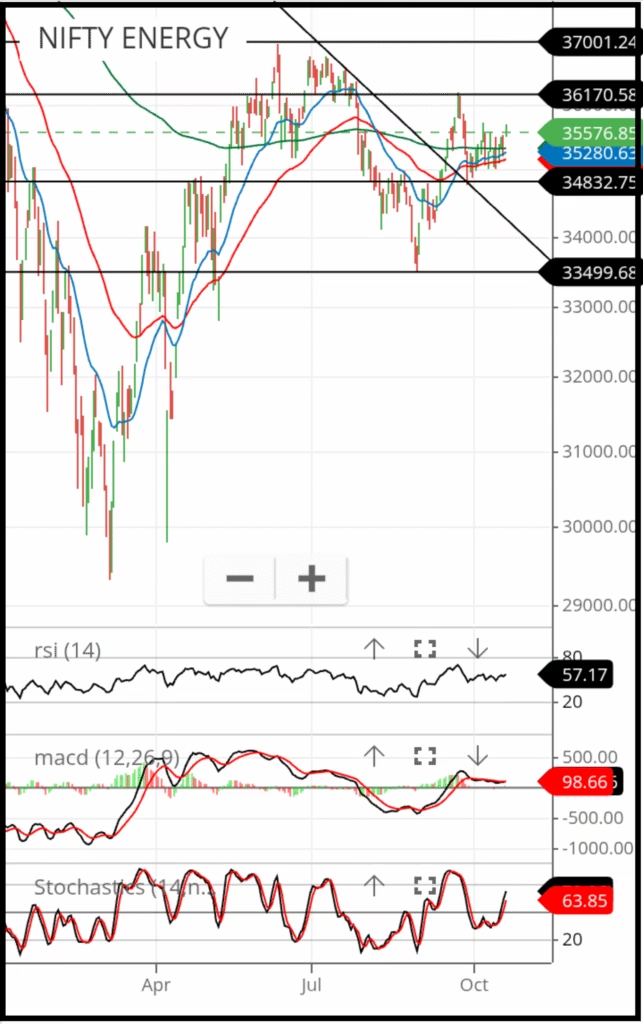
It’s Your Turn
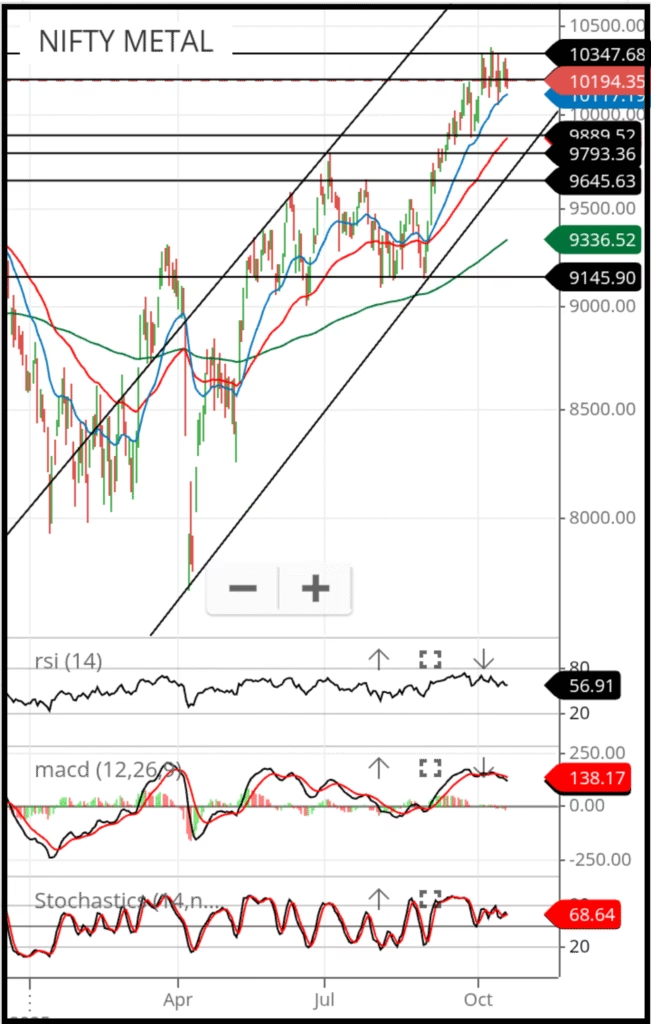
The three charts above represent the daily candlestick charts of Nifty Metals, Nifty Realty, and Nifty Energy. Each chart includes key technical tools — RSI, MACD, and Stochastic indicators, along with 20-, 50-, and 200-day EMAs — to help visualize momentum and trend direction. For clarity, trendlines, support, and resistance levels have also been drawn.
Now it’s your turn — share your views in the comments section below and tell us what you think about the current trend and outlook for Nifty Metals, Nifty Realty, and Nifty Energy.
Frequently Asked Questions (FAQs)
1. What is the outlook for Nifty 50 on 21 October 2025?
The Nifty 50 shows a positive technical setup with key support and resistance levels guiding short-term movements. The overall market tone remains constructive, though traders should monitor resistance zones before initiating new positions.
2. How is the Nifty Midcap 150 performing currently?
The Nifty Midcap 150 has broken above a key trendline drawn from its all-time high and is forming an inverted head-and-shoulders pattern. This suggests the index is preparing for a possible long-term bull run, provided it sustains above 22,510.
3. What does the Nifty Smallcap 250 chart indicate?
The Nifty Smallcap 250 is consolidating within a range of 16,479–18,096. A breakout on either side will determine the next directional move. For now, the indicators remain neutral, suggesting traders should stay cautious and avoid aggressive short-term positions.
4. Which sectors are showing strong momentum currently?
The Nifty Auto, Nifty Bank and Nifty Metal index are leading the rally with both short- and intermediate-term trends turning bullish. FMCG and Pharma remain range-bound, while IT continues to show weakness. The next move in Energy, and Realty will depend on upcoming breakout confirmations.
5. What indicators are most reliable for market trend analysis?
A combination of RSI, MACD, and Stochastic indicators, along with 20-, 50-, and 200-day exponential moving averages, provides a balanced view of market momentum. Additionally, trendlines, support, and resistance levels help confirm the strength and direction of a move.
6. How should traders interpret the current market setup?
The broader market sentiment remains cautiously optimistic. While midcap and auto , bank and metal indices suggest bullish continuation, smallcaps are still consolidating. Traders should focus on large and midcap opportunities, maintain strict stop-loss levels, and avoid overleveraging during volatile phases.
Disclaimer
The information and analysis provided in this article are for educational and informational purposes only. They should not be construed as investment advice or a recommendation to buy or sell any security, index, or financial instrument. The analysis is based on publicly available data and personal interpretation, which may differ from other market opinions.
Readers and investors are advised to consult with a qualified financial advisor before making any investment decisions. The author and the website do not assume any responsibility for losses that may occur as a result of the use of the information provided herein.