
Market Overview and Stock Market Today
The Nifty 50 opened the week on Monday at 25,843.20 and closed on Thursday at 25,877.25, showing a narrow trading range. The index is currently approaching a key resistance zone, with multiple resistance levels observed in close proximity. Technically, the market is positioned just below the overbought territory, indicating limited upside potential in the short term.
Topics of Discussion
Trading Outlook:
In such conditions, traders should exercise caution. Fresh long positions may be avoided until a decisive breakout above the resistance zone is confirmed with strong volume. Short-term traders can consider range-bound strategies, such as buying near support and selling near resistance. It’s also advisable to monitor momentum indicators closely for early signs of reversal.
Interactive Chart with Technical Analysis:
Let’s analyze this scenario further using an interactive chart to visualize resistance levels, price movements, and potential entry or exit zones.
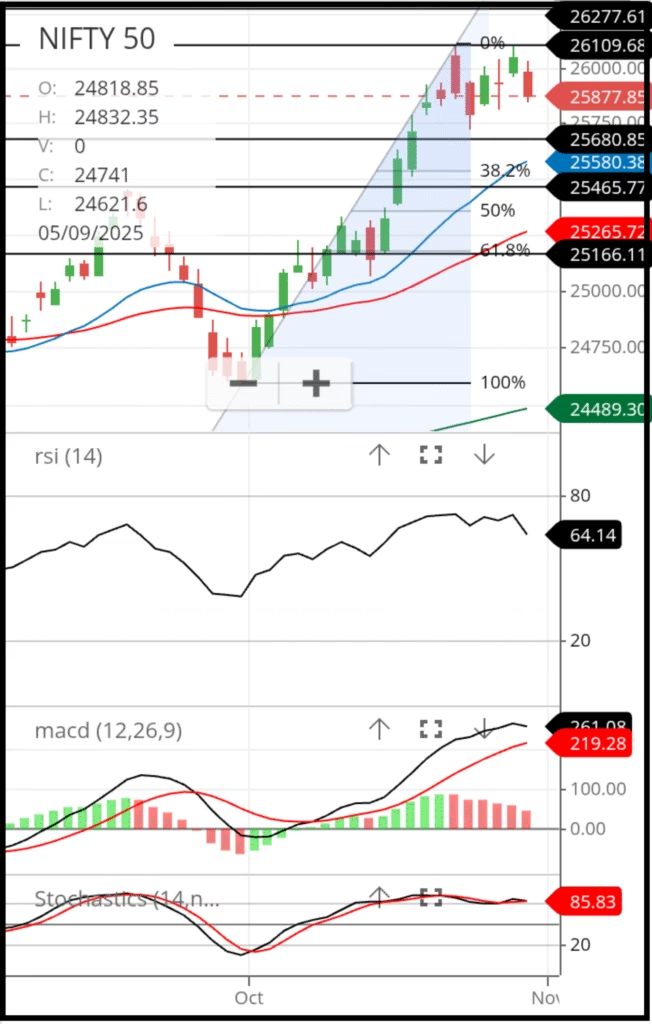
Chart Source Zerodha Kite
Chart Analysis
The 20-day, 50-day, and 200-day Exponential Moving Averages (EMA) are currently displaying a positive divergence, which indicates that the underlying market trend remains constructive over the medium to long term. However, the gap between the 20-day and 50-day EMAs has widened significantly, signaling that the market may enter a short-term consolidation phase before attempting a stronger upward move. This kind of pause is often healthy, allowing price action to realign with underlying fundamentals.
Looking at the recent price behavior, the last seven trading sessions have produced five red candles and only two green candles, showing that the short-term momentum lies in the hands of the bears. Such dominance by sellers usually points to a temporary cooling-off period rather than a complete trend reversal, especially when longer-term averages continue to show strength.
From a Fibonacci retracement standpoint, the price has not yet reached key retracement levels. This suggests that the market could spend more time consolidating before making a decisive, sustainable upward move. Waiting for prices to touch or approach these retracement levels often provides a better risk-reward entry for traders looking to ride the next bullish wave.
When we analyze technical indicators, including RSI (Relative Strength Index), MACD (Moving Average Convergence Divergence), and Stochastics, all three are showing negative divergence at higher levels. Such divergence is typically an early signal that momentum is weakening, and a period of sideways movement or mild correction could follow. The MACD histogram also supports this view, having displayed six consecutive red bars, which reinforces the likelihood of a continued consolidation phase in the short term.
Interestingly, the weekly chart still looks strong and comfortably placed in the overbought zone. While this may appear concerning to short-term traders, in reality, it reflects that the broader uptrend is still intact. A brief consolidation at this level would, in fact, make the bull run healthier and more sustainable, providing the market with the necessary base for its next move upward.
Key Insights
To summarize, the current technical setup shows a divergence between short-term weakness and medium- to long-term strength. While short-term charts hint at temporary pressure and possible sideways consolidation, the intermediate trend structure continues to support the bulls.
According to a widely accepted rule in technical analysis, when intermediate charts are strong but short-term charts appear weak, the strategy should be to buy on dips rather than chase prices during rallies.
Hence, traders and long-term investors should treat this ongoing consolidation as a healthy and natural part of the market cycle. Instead of perceiving it as a signal of weakness, it should be viewed as an opportunity to accumulate fundamentally strong and quality stocks at relatively attractive levels.
As the market stabilizes and indicators realign, the next leg of the bullish momentum is likely to emerge — potentially stronger and more sustainable than before.
Factors Affecting the Performance of Nifty 50
Nifty 50 performance is affected by macroeconomic factors like interest rates, inflation, and exchange rates; global events such as trade talks and geopolitical tensions; domestic factors like corporate earnings and supply-demand dynamics; investor sentiment including FII/DII flows; and sector-specific performance within the index’s constituents.
Macroeconomic Factors
- Interest Rates & Inflation: Higher rates increase corporate borrowing costs and can reduce economic growth and investment, negatively impacting the index. High inflation can also discourage investment.
- Exchange Rates: A strong rupee can make exports more expensive, potentially lowering demand and stock prices for export-oriented companies in the index.
- Oil Prices: Fluctuations in global crude oil prices significantly impact India’s economy and, by extension, the Nifty 50, especially the energy sector.
Global & Geopolitical Factors
- Global Economic Health: Performance of global indices (like the S&P 500) and international economic conditions create ripple effects on Indian markets.
- Trade Relations: Progress in trade talks between countries, such as India-US or US-China, can influence market sentiment and specific sectors.
- Geopolitical Tensions: Wars and global political instability create uncertainty and can trigger market downturns.
Domestic Factors
- Corporate Earnings: The performance of the 50 companies within the Nifty 50 heavily influences the index, with strong earnings boosting overall performance.
- Supply and Demand: Basic market mechanics where increased demand for stocks drives prices up, and increased supply (selling) pushes them down.
- Regulatory Changes: Sector-specific regulations or policy changes can impact companies and their sectors within the index.
Investor & Market Sentiment
- Foreign Institutional Investor (FII) Activity: Inflows or outflows from foreign institutional investors have a significant impact on market direction.
- Domestic Investment Flows: Flows from Domestic Institutional Investors (DIIs) and retail investors also play a crucial role.
- Market Volatility: General market swings driven by political tension, economic news, and investor fear or greed cause volatility.
Event-Driven Factors
- Natural Disasters: Events like floods or pandemics can disrupt economic activity, lower consumption, and negatively affect company revenues and stock prices.
- Government Policies & Elections: Fiscal and monetary policy announcements and election outcomes create significant market movements.
Conclusion
The performance of the Nifty 50 index is influenced by a wide range of macroeconomic, domestic, and technical factors. While elements such as interest rates, inflation, exchange rates, oil prices, and geopolitical developments set the broader tone for market behavior, corporate earnings, policy changes, and investor sentiment determine the depth and direction of its intermediate trends.
At present, the technical setup reflects a phase of short-term consolidation within a long-term bullish structure. Indicators such as RSI, MACD, and Stochastics reveal weakening short-term momentum, whereas the 20-day, 50-day, and 200-day EMAs still signal strength over a broader horizon. This divergence between near-term caution and long-term optimism mirrors how fundamental and global factors sometimes create temporary volatility while the overall economic outlook remains intact.
Historically, when the intermediate trend is positive but the short-term charts show weakness, the market offers a “buy-on-dips” opportunity. In the same way, when macroeconomic variables fluctuate or global events unsettle sentiment, patient investors often benefit by focusing on quality stocks with sound fundamentals rather than reacting to short-term noise.
In essence, the Nifty 50’s movement is a reflection of both economic fundamentals and market psychology. Short-term corrections and consolidations are not signs of weakness but healthy pauses that prepare the market for the next sustainable rally. For disciplined investors, this period presents an ideal time to accumulate strong, fundamentally backed companies and position portfolios for the next leg of India’s long-term growth story.
Frequently Asked Questions (FAQs)
1. Why is the stock market showing mixed signals today?
The market appears indecisive as global cues, interest rate expectations, and domestic earnings data create uncertainty, leading to both bullish and consolidating movements.
2. What does consolidation mean in the stock market?
Consolidation occurs when stock prices move sideways within a narrow range after a strong rally. It allows the market to absorb gains before starting the next major trend.
3. Is the current Nifty 50 trend still bullish?
Yes, the broader structure remains bullish as long as the index trades above its 50-day and 200-day EMAs. Short-term weakness is likely a healthy pause rather than a reversal.
4. Which indicators suggest consolidation may continue?
Indicators like RSI, MACD, and Stochastics are showing negative divergence, while multiple red candles and widening gaps between short-term EMAs indicate possible consolidation.
5. Should investors buy during consolidation phases?
When the long-term trend remains positive, consolidations are usually good opportunities to accumulate quality stocks at better valuations rather than chase rallies.
6. What global and domestic factors could trigger the next bull run?
Stable inflation, strong corporate earnings, consistent FII inflows, and favorable government policies could revive bullish momentum and help the market resume its upward trend.
Disclaimer
The views and analysis presented in this article are meant purely for educational and informational purposes. They do not represent financial advice or stock recommendations. All data and charts used are hypothetical and illustrative, designed to help readers understand market behavior and technical patterns. Investors should perform their own research or consult a SEBI-registered financial advisor before making investment decisions.