Introduction
When we think of global stock markets, the U.S., India, and the U.K. often come first. Yet another economy—Mexico—has quietly built a strong and resilient equity market of its own. The S&P/BMV IPC (Índice de Precios y Cotizaciones) is Mexico’s benchmark stock index, reflecting the combined performance of its most prominent and liquid companies. Like India’s Nifty 50 or America’s S&P 500, it represents the pulse of the country’s economic and financial strength.
While Mexico’s growth pace may seem slower, its market has maintained a long-term upward trend, backed by trade integration with the United States, solid industrial exports, and improving investor participation.
Topics of Discussion
What Is the S&P/BMV IPC?
The S&P/BMV IPC was created by the Bolsa Mexicana de Valores (BMV)—Mexico’s main stock exchange—to track the performance of leading publicly listed firms. “IPC” stands for Índice de Precios y Cotizaciones, literally meaning Price and Quotation Index.
The index is maintained by S&P Dow Jones Indices, ensuring global transparency and standardized calculation methods similar to other S&P-branded indices. It typically includes around 35 highly traded companies, reviewed and re-balanced semi-annually based on liquidity, market capitalization, and free-float adjustment.
Composition and Sector Weightage of S&P/BMV IPC
The S&P/BMV IPC gives investors exposure to Mexico’s most influential sectors:
- Telecommunications – led by América Móvil, Latin America’s telecom giant.
- Financials – including Grupo Financiero Banorte and Inbursa.
- Consumer Staples – dominated by Grupo Bimbo and Walmex (Walmart de México).
- Materials and Industrials – Cemex, Grupo México, and Alfa S.A.B.
- Energy & Utilities – smaller but steadily growing representation.
This composition gives the IPC a balanced structure—less dependent on one sector and more reflective of the real Mexican economy, which is heavily linked to exports, infrastructure, and domestic consumption.
Historical Performance of S&P/BMV IPC
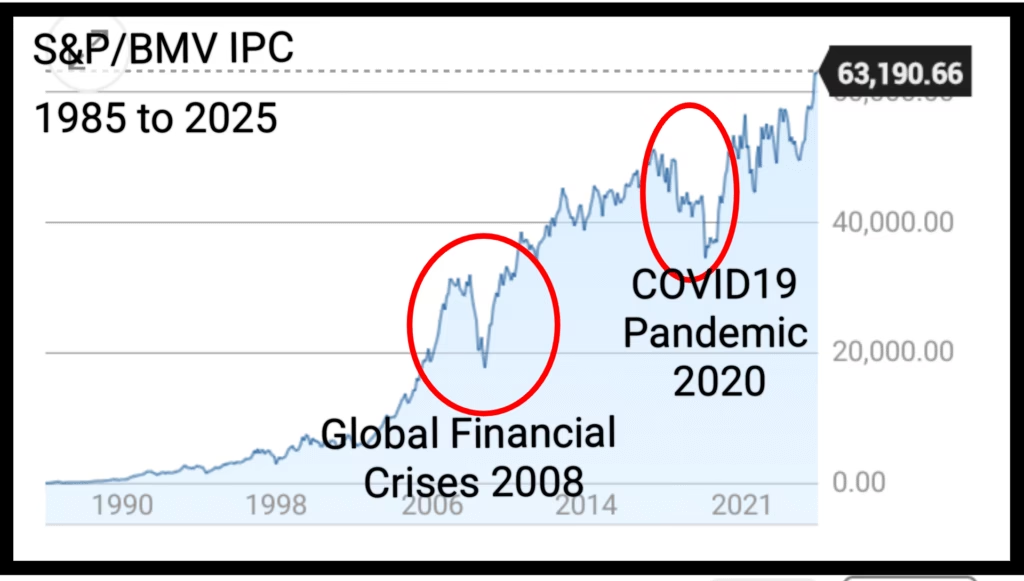
Over the past three decades, the S&P/BMV IPC has displayed a steady long-term uptrend despite periodic global shocks. After the 2008 financial crisis, it rebounded quickly, reaching new highs by 2013. Another recovery came after the pandemic-induced fall in 2020, when Mexico benefited from near-shoring trends as companies moved manufacturing closer to the U.S.
Although the IPC’s growth rate is slower than India’s Nifty 50 or the U.S. S&P 500, its structure shows resilience rather than speed. The market moves in long cycles—periods of consolidation followed by strong breakouts, often aligned with industrial growth and export data.
For long-term investors, this stability makes the Mexican market appealing as a moderately growing, lower-volatility option within Latin America.
Last 5 Years
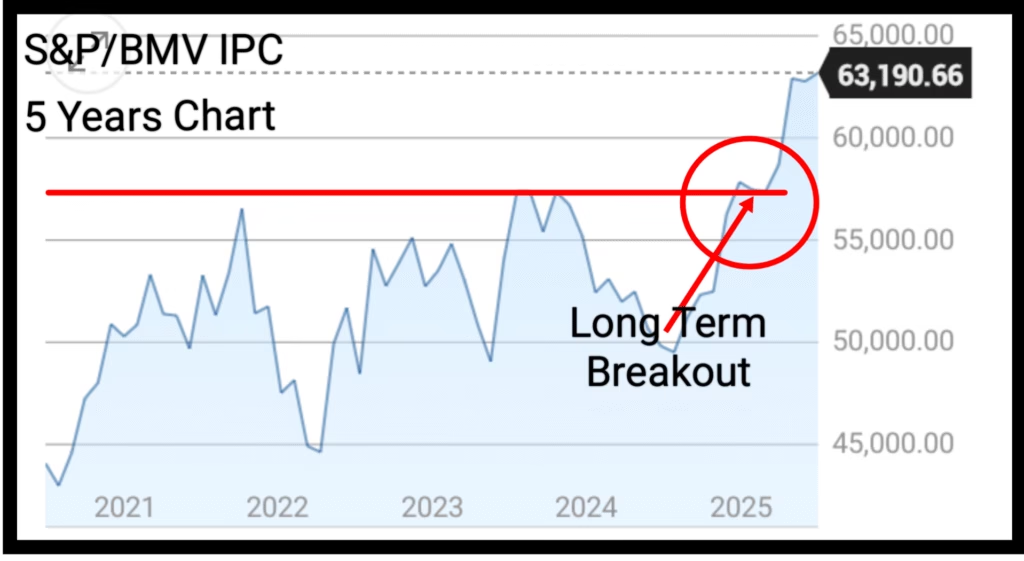
Over the past five years, the S&P/BMV IPC has predominantly remained within a trading range. This trading range forms a flag pattern, which has recently been broken in 2025. The breakout signals a potential uplift in the country’s economic and trade status. According to technical analysis, when a long-term flag pattern breaks upward, it generally indicates the onset of a long-term bull market.
Last 1 Year
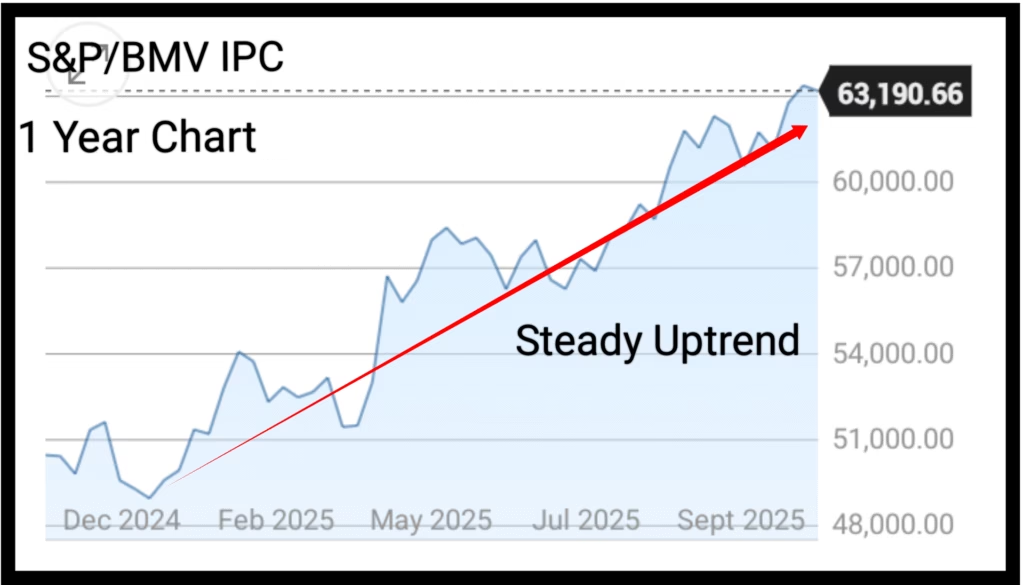
Steady Uptrend Observation
The chart for the last one year highlights a consistent uptrend from December 2024 to November 2025. This trend reflects strong economic growth and a healthy expansion in trade across the country.
Pattern of Higher Highs and Higher Lows
The chart demonstrates a continuous formation of higher highs and higher lows, with only minor corrections along the way. This behavior signals a very strong intermediate-term trend, reinforcing investor confidence in the ongoing market rally.
Monthly Candlestick Chart (Long Term Trend)
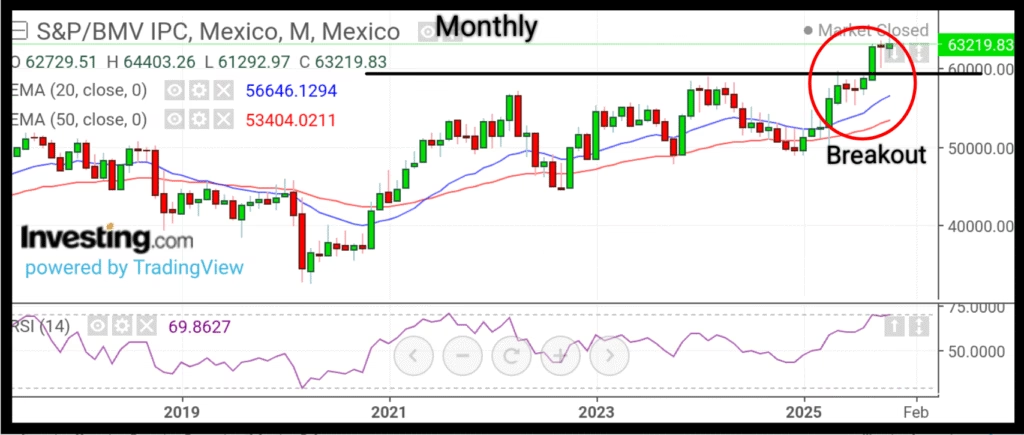
Post-Pandemic Recovery
The long-term monthly candlestick chart illustrates a sharp recovery following the COVID-19 pandemic. From 2022 to 2024, the index largely remained in a trading range, which was eventually broken in 2025.
EMA Analysis
Both the 20 EMA (Exponential Moving Average) and 50 EMA are trending upward. The 20 EMA positioned well above the 50 EMA indicates that the current upward trend is likely to continue for the long term.
RSI Insights
The RSI indicator shows that after dipping into the oversold region in 2020, it never returned to that low level and mostly stayed above 50. Currently, the RSI is 69.8627, suggesting it is approaching the overbought territory. This indicates the possibility of a short-term pullback, followed by renewed sharp rallies.
Weekly Candlestick Chart (Intermediate Term Trend)
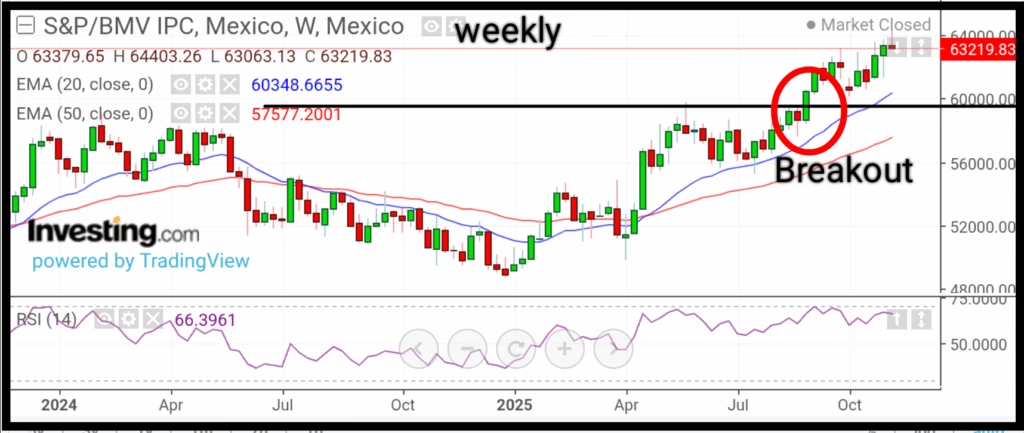
Downtrend and Recovery
The weekly chart shows that the S&P/BMV IPC experienced a downtrend from April 2024 to December 2024. Starting in January 2025, the formation of higher highs and higher lows confirmed that the intermediate-term trend is intact.
Key Breakouts and Golden Cross
In October 2025, a breakout occurred (marked by a circle on the chart). A golden crossover, when the 20 EMA crosses above the 50 EMA, indicates a strong bullish phase. This was observed in April 2025.
RSI Trend
The RSI had fallen below 50 in June 2024 and remained there until February 2024. After February, it never dipped below 50, showing that bulls dominated the intermediate-term trend. The current RSI is 66.3961, approaching the overbought level of 70, suggesting a potential correction followed by rallies.
Daily Candlestick Chart ( Short Term Trend)
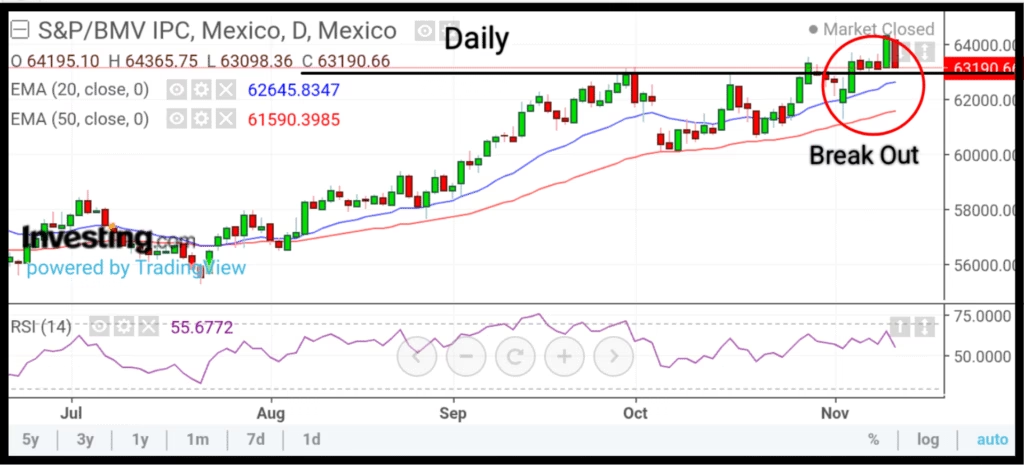
Mixed Trend in July 2025
The daily candlestick chart shows that July 2025 experienced a mixed trend. From August to early October, the market formed consecutive higher highs and higher lows, signaling a strong short-term uptrend.
EMA Golden Cross
At the beginning of August, the 20 EMA and 50 EMA completed a Golden Crossover , reinforcing the bullish trend.
Market Volatility
In October 2025, a sharp decline occurred due to trade tensions between the USA and China, but the market recovered quickly. A strong breakout level was observed at 63,190 last week, followed by a correction. It’s important to note that a breakout does not guarantee immediate upward movement but suggests strong potential for further gains, with or without a pullback.
RSI and Trend Analysis
The RSI fell below 50 in July 2025, rose above 50 from August to October, briefly fell below 50 in October, and quickly recovered above 50. The current RSI is 55.6772 and is sloping downward, indicating a mixed trend with high volatility. Overall, the short-term trend is upward but may experience minor corrections.
Economic Factors Influencing the IPC
- Trade Relations with the United States: Over 80% of Mexico’s exports go to the U.S., making cross-border trade a key driver.
- Currency Movements: The Mexican Peso (MXN) plays a crucial role. A stronger peso attracts foreign capital but can reduce export competitiveness; a weaker peso helps exporters but may raise inflation risk.
- Interest Rates & Inflation: The Bank of Mexico (Banxico) manages policy rates to balance inflation and growth. Rate stability usually supports equity valuations.
- Commodities & Energy Prices: Mexico is rich in oil, copper, and silver. Rising commodity prices often lift industrial profits and, in turn, the IPC.
- Political and Regulatory Environment: Policy clarity, fiscal discipline, and pro-business reforms are watched closely by institutional investors.
Comparison with Other Global Indices
| Index | Country | Market Type | Long-Term Trend |
|---|---|---|---|
| S&P 500 | United States | Developed | Strong Uptrend (Tech-Led) |
| Nifty 50 | India | Emerging | Rapid Growth (Domestic Demand) |
| FTSE 100 | United Kingdom | Developed | Moderate Uptrend |
| S&P/BMV IPC | Mexico | Emerging | Steady Uptrend (Trade-Driven) |
Why Global Investors Should Watch Mexico’s IPC
- Gateway to Latin America – It offers exposure to one of the most stable markets in the region.
- Trade-Linked Growth – Benefits from U.S. manufacturing expansion and near-shoring.
- Reasonable Valuations – Compared with the U.S. and Indian markets, many Mexican blue-chips still trade at lower P/E ratios.
- Currency Diversification – Investing in peso-denominated assets can add global balance to a portfolio.
- Low Media Competition – Few analysts cover it in English, leaving room for investors seeking under-researched opportunities.
Future Outlook
Mexico’s economy is projected to grow steadily as supply chains shift closer to North America. The USMCA trade agreement ensures long-term policy alignment with the U.S. and Canada, while foreign direct investment (FDI) in manufacturing and logistics continues to rise.
If inflation remains moderate and political stability is maintained, analysts expect the S&P/BMV IPC to sustain its gradual uptrend over the next decade. Investors watching for technical breakouts or sector rotation could find attractive medium-term opportunities.
Language and Market Accessibility
Although Mexico’s official language is Spanish, global investors need not worry—major platforms such as Investing.com, Yahoo Finance, and S&P Global provide full English coverage for the IPC. Most financial professionals in Mexico are bilingual, making market data and corporate reports accessible to international readers.
Conclusion
The S&P/BMV IPC stands as a symbol of Mexico’s economic resilience and its close connection with North American trade. While it may not deliver the explosive returns seen in India or the tech-heavy U.S. markets, its consistent long-term growth reflects solid fundamentals and industrial strength.
For investors seeking steady emerging-market exposure with lower volatility, Mexico’s benchmark index deserves attention. By combining technical analysis, historical data, and macro-economic insight, one can appreciate how the IPC has quietly maintained an upward path amid global market cycles.
Frequently Asked Questions
Q1. What is the S&P/BMV IPC?
The S&P/BMV IPC is the main stock market index of Mexico. It tracks the performance of around 35 major companies listed on the Bolsa Mexicana de Valores (BMV).
Q2. What does IPC stand for in the Mexican stock market?
IPC stands for Índice de Precios y Cotizaciones, which means Price and Quotation Index in English.
Q3. Is the S&P/BMV IPC similar to the Nifty 50 or S&P 500?
Yes. Just like India has the Nifty 50 and the U.S. has the S&P 500, Mexico’s main index is the S&P/BMV IPC. It represents the overall performance of Mexico’s leading companies.
Q4. Is the Mexican stock market in a long-term uptrend?
Yes. The Mexican market has shown a steady long-term uptrend, supported by trade with the U.S., industrial growth, and stable financial policies.
Q5. Which are some major companies in the S&P/BMV IPC?
Some of the biggest companies include América Móvil, Grupo Bimbo, Cemex, Walmex (Walmart de México), and Grupo Financiero Banorte.
Q6. Can foreign investors invest in the S&P/BMV IPC?
Yes. Foreign investors can invest through international brokers or ETFs that track the S&P/BMV IPC, giving exposure to the Mexican stock market.
Q7. Do people in Mexico speak English in the financial sector?
The main language in Mexico is Spanish, but many professionals in finance and business also speak English, especially in cities and investment-related fields.
Q8. Where can I see the live chart of the S&P/BMV IPC?
You can view the live chart, price movements, and technical indicators of the S&P/BMV IPC on platforms like Investing.com, Yahoo Finance, or TradingView.
Q9. Is it safe to invest in the Mexican stock market?
Like all markets, investing in Mexico involves some risk, but the S&P/BMV IPC represents large and stable companies. With a long-term view, it is considered relatively steady among emerging markets.
Read More