Performance of S&P500
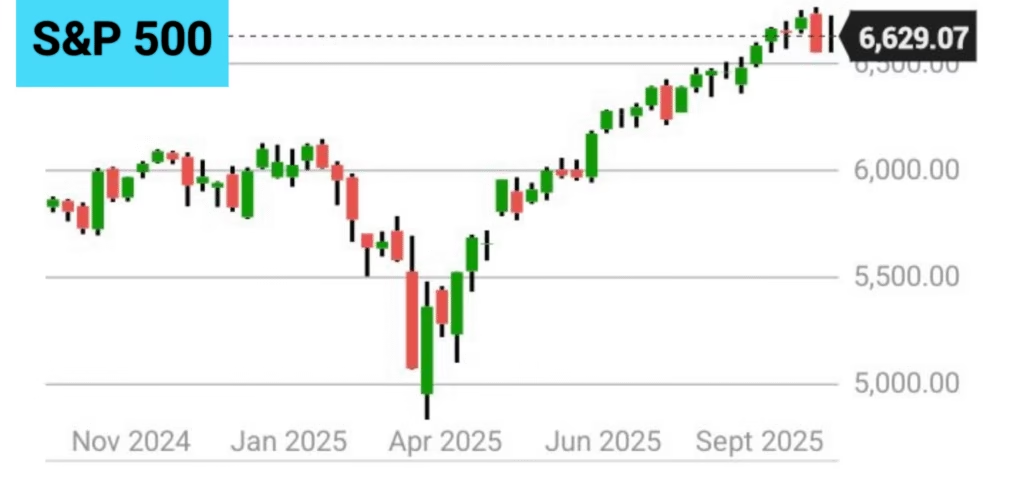
The S&P 500 has experienced some fluctuations this week, ending on October 16, 2025, at 6,629.07 after a 5-day decline of 0.63%. During this period, the index saw significant daily swings, recovering from a previous drop but later falling due to renewed concerns.
Earlier in the week, on October 15, the S&P 500 closed at 6671.06 points, a 0.40% gain, bolstered by strong bank earnings and a rally in chip stocks. This followed a rally on October 13, where the index had rebounded. However, by October 16, the market turned downward, led by banking sector losses driven by fears over bad loans and persistent trade tensions. Despite the short-term decline, analysis from July 2025 by J.P. Morgan projected the S&P 500 to close above 6,000 by year-end, with double-digit earnings growth.
Topics of Discussion
A Snapshot of US Stock Market
Here’s a snapshot of how the major indices closed:
| Index | Close | %Change |
| Dow Jones | 45952.24 | -0.65 |
| Nasdaq | 22562.54 | -0.47 |
| S&P 500 | 6629.07 | -0.63 |
Technical Analysis of S&P 500
Here is a technical overview of the S&P 500 index based on data up to October 16, 2025. Please note that technical analysis focuses on past price movements to predict future trends
Resistances and Supports Table
| Close | 6629.07(-0.63%) |
| Resistances | Levels |
| 1 | 6726 |
| 2 | 6838 |
| 3 | 6990 |
| Supports | Levels |
| 1 | 6602 |
| 2 | 6557 |
| 3 | 6490 |
Moving Average Table
| Period (Days) | Simple | Exponential |
| 5 | 6630 | 6657 |
| 10 | 6681 | 6662 |
| 20 | 6674 | 6649 |
| 50 | 6658 | 6550 |
| 100 | 6358 | 6385 |
| 200 | 6062 | 6143 |
Oscillator Table
| Indicator | Vaue | Inference |
| RSI(14) | 48.67 | Neutral |
| Stoch (9,6) | 45.37 | Neutral |
| MACD (12,26) | 28.30 | Buy |
| ADX | 35.60 | Buy |
Insights
Technical Indicators: The current trend is strongly bullish, supported by moving averages, but caution is advised due to neutral conditions indicated by the Stochastic and RSI indicators potentially signaling an increase in volatility.
Current Price: 6,629.07 as of October 16, 2025.
Key Resistance: Resistance is identified in the 6726 – 6838 area. A break above 6838 could signal further gains towards 6990.
Key Support: Failure to breach the resistance levels could lead to a decline towards 6602. A break below 6557 would increase selling pressure, potentially pushing the index down to 6490.
Trading Range: The index is currently experiencing an bullish outlook, likely trading within a range of 6830-6490. A breakout from this range is crucial to determine the next significant move.
Analysts and Top Institutional Investors View
As of mid-October 2025, analysts and top institutional investors hold a cautiously optimistic view on the S&P 500, with expectations for continued positive returns but with high valuations and market concentration risks. The outlook is supported by steady economic expansion, strong corporate earnings, and supportive monetary policy, but tempered by geopolitical uncertainties and a reliance on a handful of tech giants.
Analyst perspectives
- Positive outlook: Many strategists predict a third consecutive year of gains for the S&P 500 in 2025.
- Earnings growth: Goldman Sachs forecasts an 11% earnings-per-share (EPS) increase for 2025, with potential for further growth into 2026. This growth is seen as broad-based, with improved performance anticipated across seven of the 11 market sectors in the final quarter of 2025.
- Economic fundamentals: Expectations of continued economic expansion and cooling inflation support corporate revenue growth and overall market performance.
- Cautious notes: Despite the positive outlook, several factors raise concerns among analysts.
- High valuations: The S&P 500’s price-to-earnings (P/E) multiple is significantly high compared to historical standards, suggesting the market is priced for perfection and increasing the risk of a correction if growth expectations are not met.
- Concentration risk: Much of the index’s performance is driven by a small number of AI-related “Magnificent 7” technology stocks. Analysts warn of elevated concentration risk and the need for broader market participation to sustain gains.
- Technical uncertainty: Near-term technical analysis suggests a mixed outlook, with the index potentially oscillating within a defined range. A decisive breakout in either direction is needed for a clearer picture.
Institutional investor sentiment
- Optimism with diversification: Institutional investors remain optimistic but are also diversifying their portfolios.
- Tech excitement: AI and technological innovation are cited by many institutional investors as the most exciting drivers for 2025.
- Alternative assets: Following a volatile period, many institutional investors are increasing their allocations to private markets and alternative assets, including private equity and credit, for potentially better risk-adjusted returns.
- Shifting allocations: Surveys indicate a significant drop in “very bullish” sentiment for overall market returns compared to the previous year, suggesting a move towards more conservative strategies.
- Beyond mega-caps: Some institutional activity shows broadening risk appetite beyond large-cap tech.
- Small- and mid-cap stocks are starting to attract more attention due to attractive valuations after underperformance in recent years.
- An increase in bullish sentiment across a wider range of sectors, including financials and mid-caps, suggests a potential broadening of the market rally.
- Geopolitical considerations: Geopolitical tensions, particularly involving US-China trade, are a key risk factor for institutions. Global trade policies could cause a downshift in growth and impact corporate supply chains, a significant concern for international companies within the S&P 500.
Also Read

Factors Affecting the Performance of S&P 500
The S&P 500’s performance is affected by a combination of factors, including the market capitalization-weighted performance of its 500 component companies, broader economic indicators, monetary policy, market sentiment, and geopolitical events. The index is heavily influenced by a small number of large companies, particularly in the technology sector, due to its market-capitalization-weighted structure.
Economic and monetary policy factors
- Economic health: The S&P 500 is a key indicator of U.S. economic health, with its performance generally correlating with the overall state of the economy. A rising S&P 500 can indicate a strong and growing economy, while a falling index may signal potential economic challenges or a recession.
- Corporate earnings: The collective earnings growth of the 500 constituent companies is a fundamental driver of the index. Strong earnings reports tend to boost the index, while weak results can cause a decline. Due to the market-capitalization-weighted nature of the index, the earnings of the largest companies, like Apple and Microsoft, have a more significant impact.
- Interest rates: Decisions by the Federal Reserve, particularly on interest rates, significantly impact the market. Lower interest rates can stimulate economic growth and boost stock prices by making borrowing cheaper and bonds less attractive. Conversely, higher interest rates can put downward pressure on the market.
- Inflation: High inflation can reduce corporate profits and consumer spending, which tends to negatively affect stock valuations. The Federal Reserve’s response to inflation also influences interest rates, which further affects the market.
- GDP and employment: Overall economic indicators like Gross Domestic Product (GDP) and the unemployment rate reflect the strength of the economy and influence investor confidence.
Market and geopolitical factors
- Market sentiment: The overall psychological state of investors—whether they are optimistic (bullish) or pessimistic (bearish)—plays a significant role in market movements. This can be influenced by economic data, corporate news, and global events.
- Index composition: The S&P 500 is regularly reviewed and rebalanced, with companies added or removed based on market capitalization, liquidity, and financial viability. These changes can impact the index’s performance, as funds that track the index must buy and sell shares to adjust. The growing weight of the technology sector, in particular, has increasingly influenced the index’s performance.
- Geopolitical events: Wars, trade disputes, and sanctions can create market uncertainty, disrupt supply chains, and cause volatility. While short-term impacts can be significant, the market has historically shown long-term resilience.
- Commodity prices: Fluctuations in key commodity prices, especially oil, can impact many of the companies within the S&P 500 and, in turn, the index.
Disclaimer
The information provided on this website is for educational and informational purposes only. It should not be considered as financial, investment, or trading advice. The views and analyses expressed are based on publicly available data and personal research and are not recommendations to buy, sell, or hold any securities.
Investing in the stock market and mutual funds involves risks, including the possible loss of principal. Past performance is not indicative of future results. Readers are encouraged to conduct their own research or consult a qualified financial advisor before making any investment decisions.
The website owner and authors shall not be held liable for any direct or indirect losses arising from the use of the information provided here. By using this site, you agree that you are solely responsible for your investment actions.