A Quick Recap of Past Performance
The Nifty began its decline from the all-time high of 26,277, recorded on 27th September 2024, and continued its downward trend until 7th April 2025, hitting a low of 22,743 — a correction of 4,334 points, or 16.49%.
From 8th April 2025 onward, the index staged a strong recovery, gaining 4,134 points, which accounts for a 99% rebound from its previous fall — a rise of approximately 19%.
However, during this ongoing bull phase that began in April, most sectors have underperformed relative to the Nifty 50. Even the Nifty Smallcap 250 index failed to mirror the benchmark’s strength. This suggests that the current rally is sector-specific rather than broad-based.
Understanding the overall trend of the Nifty 50 alone is not sufficient for trading effectively. To achieve consistent results, it’s essential to identify which sectors are leading the market and which are lagging behind.
In short, successful trading requires a clear understanding of sector-specific performance.
Topics of Discussion
Technical Analysis of Nifty 50
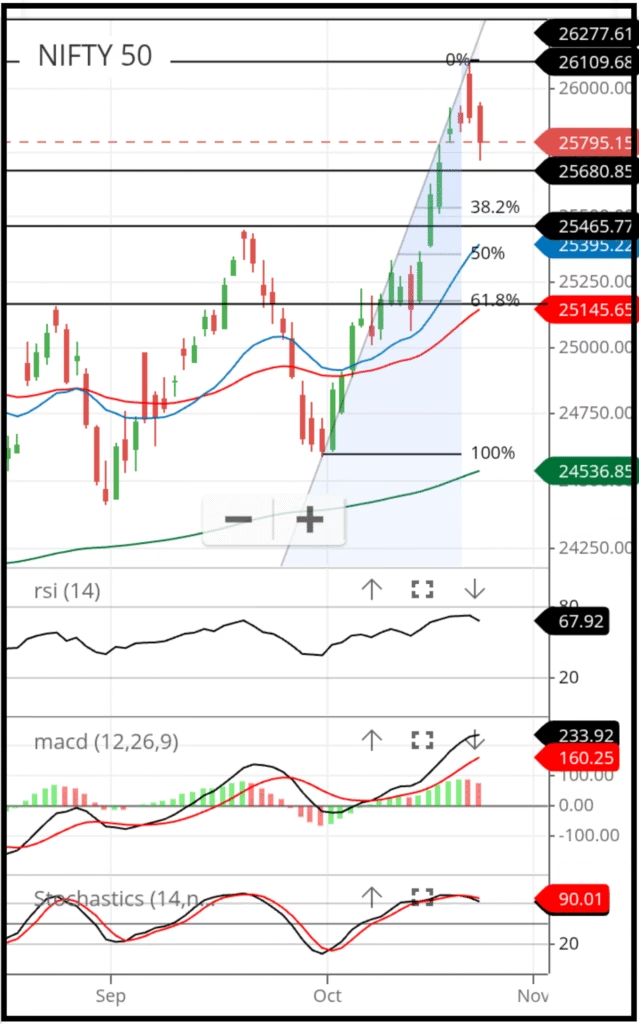
Chart Source: Zerodha Kite (For Education Purpose)
Chart Description:
To avoid repetition, readers are advised to refer to the article “Stock Market Prediction: 20 Oct 2025 – & Bank Nifty Outlook” ( Card below the technical analysis section) for a detailed chart analysis. That article also provides a brief explanation of the methods used to predict Nifty’s movement.
Chart Observation
The Nifty 50 index began its short-term rally at the start of this month, rising from 24,587 and reaching a high of 26,104 on 23rd October. Within just 15 trading sessions, the index gained 1,517 points, marking an impressive 6.17% rise.
However, in the last two trading sessions, Nifty 50 has entered a minor correction phase. The key question now is — how deep could this correction go?
Fibonacci Retracement level
Out of the Fibonacci retracement levels-37.5, 50.0, 62.5 and 100%, but a 37.5% retracement seems possible. Based on this calculation:
26,104 – (1,517 * 37.5 / 100) = 25,535
This level of 25,535 is derived from the Fibonacci method, but it’s important to note that this is not a strict rule, only an assumption.
Two strong support-resistance zones can be clearly identified in this range — 25,680 and 25,465. Traders may consider starting buying positions around these levels, though it’s advisable to keep some funds reserved in their trading account to take advantage of any further downside movement.
Support and Resistance
Nifty 50 has already surpassed all major resistances except for the all-time high at 26,277. At this stage, psychological resistances tend to act as significant barriers — for example, levels like 26000, 26,500, 27,000, and 27,500 are expected to serve as major resistance points.
On the support side, key levels to watch are 25,000, 25,450, and 25,676.
Trendline Analysis
When an upward trendline is drawn from the low created on 7th April, it indicates a support level around 25,350. This implies that for the ongoing intermediate uptrend to reverse, Nifty would need to fall by nearly 1,000 points from high of 26104 — a scenario that seems unlikely in the current context.
Additionally, Nifty has broken out of a triangle pattern formed between July and the end of September, signaling that the intermediate uptrend is strong and likely to continue in the coming months.
Nevertheless, short pullback rallies cannot be completely ruled out within this intermediate bullish trend.
Moving Averages
Currently, the 20-day, 50-day, and 200-day exponential moving averages (EMAs) are positioned below the Nifty 50’s price level. The slopes of the 20-day and 50-day EMAs are becoming increasingly steeper, which indicates that the rally is gradually gaining strength.
However, the widening gap between the price and the moving averages suggests that a short-term correction would be healthy to maintain a sustainable uptrend.
The current values are as follows:
Nifty 50: 25,795.15
20-day EMA: 25,395
50-day EMA: 25,145
200-day EMA: 24,536
MACD (Moving Average Convergence Divergence)
The MACD line is currently trading above its signal line, which is a positive indication. Additionally, there are six ascending histogram bars above the zero line, further confirming bullish momentum.
MACD Value: 233.92
Signal Line Value: 160.25
This setup clearly indicates that the intermediate-term uptrend remains intact.
RSI and Stochastics
The Relative Strength Index (RSI) is currently at 67.92, lying just below the Overbought zone while the Stochastic Oscillator stands at 90.01, lying in the overbought zone.
However, being in the overbought region does not necessarily mean that traders should immediately square off their buy positions. Instead, it suggests that a short-term correction might occur. Traders should therefore maintain a trailing stop-loss on their existing long positions to safeguard profits.
Also Read


Sectors to Watch
Leading Sectors
The key outperformers driving this bull run include:
Nifty Bank
Nifty Financial Services
Nifty Auto
Nifty Metal
Sectors in Trading Range
The following sectors are currently trading within a range, showing limited movement:
Nifty FMCG
Nifty Pharma
Nifty Energy
Nifty CPSE
Nifty Realty
Underperforming Sectors
During this phase, the underperformers have been:
Nifty IT
Nifty Media
Performance by Market Capitalization
Large Cap: Performing well
Mid Cap: Performing well
Small and Micro Cap: Underperforming
Note: A detailed analysis of Nifty sectors and their performance will be covered in our next post, scheduled for publication on 26th October 2025. Stay tuned for insights into which sectors are driving the market and which ones are lagging behind.
Key Insights:
The current technical setup of Nifty 50 suggests that the market remains in a strong intermediate uptrend, supported by bullish signals across most indicators. While a short-term correction toward the 25,500–25,600 zone is possible as per Fibonacci retracement levels, the broader trend continues to favor the bulls.
The MACD, moving averages, and trendline analysis all confirm ongoing momentum, whereas RSI and Stochastics indicate mild overbought conditions that could trigger brief pullbacks — not a reversal.
From a sectoral perspective, leadership lies with Banking, Financial Services, Auto, and Metal, while FMCG, Pharma, and Energy sectors are consolidating. IT and Media remain the notable laggards.
Overall, Nifty 50 appears technically strong, and any dips near key support levels should be viewed as buying opportunities rather than signs of weakness. Traders are advised to maintain trailing stop losses and manage cash positions wisely to take advantage of short-term corrections within this ongoing bullish phase.
Factors Affecting the performance of Nifty 50
Factors affecting the performance of the Nifty 50 include a mix of domestic and global influences, economic indicators, corporate performance, government policy, and market sentiment. These interconnected elements contribute to market volatility and overall index movement.
Economic and monetary factors
- Economic indicators: Key indicators like Gross Domestic Product (GDP) growth, industrial production, and employment rates signal the overall health of the Indian economy. A healthy economy generally correlates with a strong Nifty 50, while a slowdown can have a negative impact.
- Inflation and interest rates: High inflation can diminish purchasing power and increase corporate costs, negatively affecting stock prices. In response, the Reserve Bank of India (RBI) might raise interest rates, which increases borrowing costs for companies and dampens economic activity.
- Exchange rates: Fluctuations in the Indian rupee’s value against other currencies, such as the US dollar, can affect the profitability of companies with international operations.
- Crude oil prices: As an importer of crude oil, India’s economy is sensitive to oil price changes. Rising oil prices can increase inflation and negatively impact the stock market.
Global influences
- Global market trends: The Indian market is highly correlated with major global indices like the S&P 500 and the Dow Jones. Significant movements in these markets can trigger similar changes in the Nifty 50.
- Foreign Institutional Investment (FII): The buying and selling activity of foreign investors can have a substantial impact on market liquidity and sentiment. Significant capital outflows from FIIs can exert downward pressure on the market.
- Geopolitical events: International events like trade tensions, geopolitical conflicts, and economic crises in major global economies can create market uncertainty and volatility.
Domestic and corporate factors
- Corporate performance: The earnings reports, revenue growth, and profit margins of the 50 constituent companies significantly influence the index. Strong earnings can drive the Nifty 50 up, while disappointing results can cause a decline.
- Sectoral performance: The performance of specific industries can affect the Nifty 50, especially sectors with a large weightage, such as banking and IT. Trends within these sectors are closely watched by investors.
- Government policies: Government decisions on taxation, fiscal policy, infrastructure spending, and elections can significantly impact investor confidence and market direction.
- Investor sentiment: Market sentiment, driven by news, rumors, expert opinions, and even social media, can influence short-term price fluctuations and volatility. Behavioral biases such as “herd mentality” also play a role.
Experts and Analysts View on Nifty 50
Analysts and experts hold varied views on the Nifty 50 across different timeframes, though a generally positive outlook prevails in the medium to long term. For the short term, some anticipate range-bound movement with a positive bias, while others note potential volatility due to factors like global trends and profit-taking after recent rallies.
Short-term outlook (1–3 months)
- Range-bound consolidation: After recent rallies, many experts expect a phase of consolidation or range-bound trading. Key support is seen around 25,800, with resistance near 26,050–26,100. A decisive break above the 26,000–26,100 level could trigger a fresh rally.
- Bullish bias with caution: Despite consolidation, the underlying trend remains bullish, supported by strong technical indicators such as the Relative Strength Index (RSI). However, volatility may increase due to global cues and month-end derivatives expiry.
- Buy on dips: Some analysts recommend a “buy on dips” strategy, advising short-term traders to look for entry points near support levels like 25,700.
Medium-term outlook (6–12 months)
- Strong domestic fundamentals: The Indian equity market is expected to remain resilient in the second half of 2025, supported by strong domestic macroeconomic fundamentals and policy momentum.
- Continued upward trajectory: Analysts believe the index may not stay below the 26,000 mark for long, with potential for further gains. Some forecasts suggest the Nifty could head toward the 27,500 level or higher by the end of 2025, driven by robust earnings and liquidity.
- Potential for new highs: Experts like Rahul Ghose, CEO of Hedged.in, anticipate new all-time highs by early 2026 if catalysts emerge. A report by smallcase managers also highlights the potential for the Nifty to reach 27,500 in the second half of 2025, especially if it breaks past the resistance at 26,300.
Long-term outlook (2+ years)
- Resilience and growth: Analysts remain positive on India’s long-term growth story, supported by a projected GDP growth of 6–7% and robust corporate results.
- Passive investing gaining momentum: As the market matures, passive investing through Nifty 50 index funds is seen as a logical choice for long-term wealth creation, with some index funds showing consistent historical performance.
- Higher targets possible: Based on long-term studies, some analysts suggest a potential target for the Nifty 50 between 30,200 and 30,500 in the long run.
FII and DII’s activity and view on Nifty 50
Over the course of 2025, Foreign Institutional Investors (FIIs) have been significant net sellers in the Indian market, withdrawing billions of dollars due to factors like high Indian valuations and more attractive opportunities elsewhere. However, FII selling has moderated more recently, and in October 2025, they turned net buyers for the first time in months, pumping in nearly ₹8,000 crore. In contrast, Domestic Institutional Investors (DIIs) have been a stabilizing force, providing a strong counterbalance by consistently investing record amounts throughout the year, driven by strong domestic liquidity from sources like Systematic Investment Plans (SIPs). This has led to a historic shift where DII holdings in Indian stocks have surpassed those of FIIs.
FII Activity and View on Nifty 50
- Overall selling in 2025: For most of 2025, FIIs were net sellers, pulling out around ₹1.98 lakh crore by early October. This selling pressure was a primary factor contributing to the Nifty 50’s underperformance compared to other global markets during this period.
- Shift in sentiment in October: The trend reversed in October 2025, with FIIs turning net buyers for the first time in three months. Analysts attribute this shift to several factors, including signs of stabilizing Indian market valuations and improving corporate earnings expectations for FY27.
- Motivation for selling: The earlier large-scale FII withdrawals were primarily driven by higher valuations in India relative to cheaper markets elsewhere, global market dynamics, and geopolitical risks.
- Impact on the market: While periods of heavy FII selling can cause volatility, their recent return to buying in October has coincided with a rally in both the Nifty 50 and Sensex.
DII Activity and View on Nifty 50
- Consistent buying throughout 2025: DIIs have shown consistent and robust inflows into the Indian equity market throughout 2025, pumping in a record ₹6 trillion by mid-October.
- Stabilizing influence: The sustained domestic buying has been a crucial stabilizing factor for the Nifty 50, cushioning the market against significant corrections that could have been triggered by FII outflows. DIIs frequently buy during periods of FII selling, preventing extreme market falls.
- Increasing dominance: The steady flow of funds from DIIs, largely fueled by retail investors through SIPs, has given them a more prominent role in the Indian market. As of March 31, 2025, DII holdings surpassed FII holdings for the first time, marking a historic shift towards greater domestic market resilience.
- Sectoral preferences: In 2025, DIIs increased investments in sectors like banking, capital goods, healthcare, and automobiles.
Combined impact on Nifty 50
The contrasting strategies of FIIs and DIIs highlight a maturing dynamic in the Indian stock market. While FIIs can still influence short-term volatility based on global sentiment, the robust and consistent buying by DIIs provides a crucial domestic support system. This growing dominance of domestic capital has increased the Nifty 50’s resilience, suggesting a decreased dependency on foreign funds to drive market direction, particularly in the medium to long term.
Frequently Asked Questions (FAQs)
1. What does the Nifty 50 technical analysis indicate right now?
The current analysis suggests that Nifty 50 is in a strong intermediate uptrend. Indicators like the MACD, trendline, and moving averages confirm bullish momentum, though a short-term correction phase may occur before the next leg up.
2. What are the key support and resistance levels for Nifty 50?
Nifty 50 currently faces resistance at 26,277 (all-time high) and 26104 followed by psychological levels of 26,000, 26,500, and 27,000. On the downside, support levels exist near 25,000, 25,450, and 25,676.
3. What role does Fibonacci retracement play in this analysis?
Based on Fibonacci retracement, a 37.5% correction from the recent high of 26,104 indicates a potential retracement toward 25,535. This area may act as a buying zone, but Fibonacci levels should be used alongside other technical signals for confirmation.
4. Which sectors are driving the current Nifty rally?
The sectors fueling this rally include Nifty Bank, Nifty Financial Services, Nifty Auto, and Nifty Metal. These sectors have shown strong momentum, contributing significantly to Nifty’s recent upward movement.
5. What do RSI and Stochastics say about Nifty’s momentum?
With RSI at 67 and Stochastics at 90, Nifty is in the overbought zone, indicating strong momentum with possible short-term cooling. Traders should keep a trailing stop loss instead of closing positions prematurely.
6. How should traders position themselves for the coming sessions?
Traders are advised to remain cautiously optimistic — continue to hold long positions while staying prepared for short-term pullbacks. Maintaining cash reserves and buying near support zones can provide better opportunities in this ongoing uptrend.

Disclaimer:
The content shared in this Nifty 50 Technical Analysis is intended solely for educational and informational purposes. It should not be treated as investment, trading, or financial advice.
Market movements are inherently uncertain, and all analysis presented here is based on technical indicators and personal interpretation. Past performance of Nifty 50 or any sectoral index does not guarantee future results.
Charts and visual data used from third-party sources are included only for educational reference, and Smart Investello Research and Analysis (SIRA) does not claim ownership or accuracy of such external data.
Additionally, SIRA holds no responsibility for any ad clicks, external website links, or sponsored promotions displayed on this page. Users are advised to exercise discretion before interacting with third-party content or advertisements.
Always consult a SEBI-registered financial advisor before making investment or trading decisions. The author and SIRA, Mr Md Raji shall not be held liable for any financial losses arising from the use of this analysis.