
Nifty 50 Ends Higher — FMCG, Realty, Pvt Banks and Consumer Durable Lead the Charge
On October 16, 2025, the Nifty 50 closed at 25,585.3 with 1.03 % gain.
Sector-wise FMCG, Realty, Pvt Banks and Consumer Durable stocks led the rally, while Other sectors posted modest gains.
In market breadth, Largecap indices outperformed Midcap and Smallcap segments, reflecting robust participation from broader markets.
Table of Contents
- Nifty 50 Ends Higher After US Market Recovery — Midcaps Lead the Charge
- Review of Current Indian Stock Market
- Technical Analysis of Nifty 50
- Insights
- Sector Analysis
- Factors Affecting the Performance of Nifty 50
- View of Investors and Analysts
- Frequently Asked Questions (FAQs)
Review of Current Indian Stock Market
Here’s a snapshot of how the major indices closed:
- The Nifty 50 rose 1.03% to close at 25,585.30.
- The Nifty Midcap 150 rose 0.47% to close at 21,900.9.
- The Nifty Smallcap rose 0.38% to close at 17,117.20.
Quick Review Table
| Index | Close | %Change |
| Nifty 50 | 25,585.30 | 1.03 |
| Nifty Midcap 150 | 21,900.9 | 0.47 |
| Nifty Smallcap 250 | 17,117.20 | 0.38 |
Also Read


Technical Analysis of Nifty 50
Here is a technical overview of the Nifty 50 index based on data up to October 15, 2025. Please note that technical analysis focuses on past price movements to predict future trends.
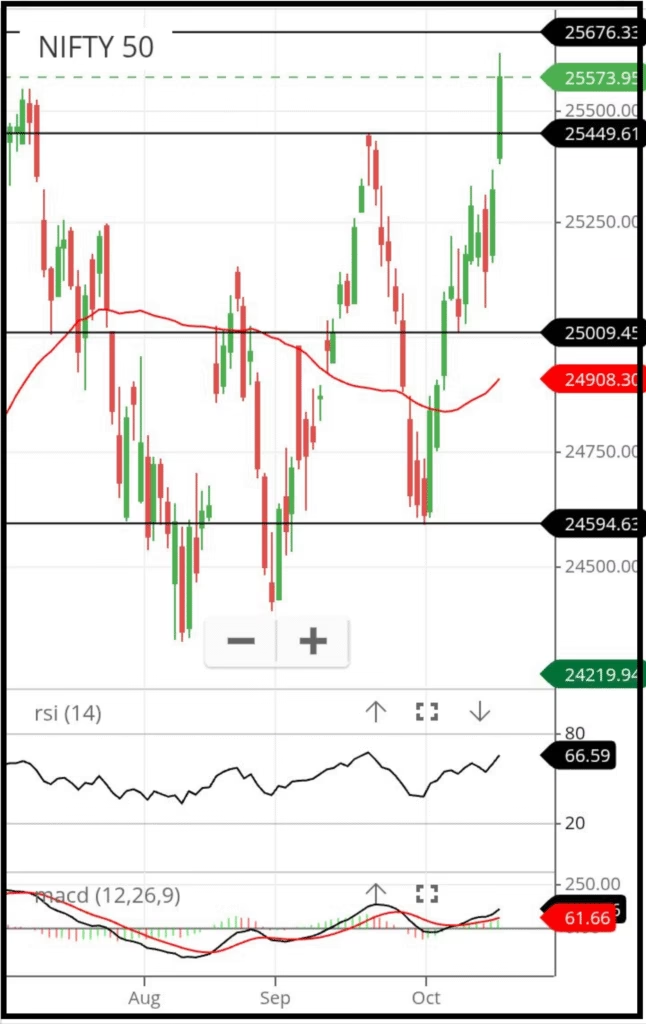
Resistances and Supports Table
| Close | 25,585.3 |
| Resistances | Levels |
| 1 | 25990 |
| 2 | 25676 |
| 3 | N A |
| Supports | Levels |
| 1 | 25449 |
| 2 | 25009 |
| 3 | 24594 |
Moving Average Table
| Period (Days) | Simple | Exponential |
| 5 | 25309⬆️ | 25332⬆️ |
| 10 | 25186⬆️ | 25225⬆️ |
| 20 | 25083⬆️ | 25101⬆️ |
| 50 | 24908⬆️ | 25015⬆️ |
| 100 | 24997⬆️ | 24777⬆️ |
| 200 | 24219⬆️ | 24504⬆️ |
Oscillator Table
| Indicator | Vaue | Inference |
| RSI(14) | 66.59 | Buy |
| Stoch (9,6) | 100 | Overbought |
| MACD (12,26) | 61.66 | Buy |
| ADX | 18.21 | Neutral |
Insights
- Current Price: 25,585.3 as of October 16, 2025.
- Key Resistance: Resistance is identified in the 25,990 – 26010 area. A break above 25,990 could signal further gains towards 25,676.
- Key Support: Failure to breach the resistance levels could lead to a decline towards 25,449. A break below 25,449 would increase selling pressure, potentially pushing the index down to 25009.
- Trading Range: The index is currently experiencing an bullish outlook, likely trading within a range of 25449-25990. A breakout from this range is crucial to determine the next significant move.
- Recent Performance: The Nifty 50 recovered 25,060 on October 14th but then recovered smartly on October 15th and 16th.
- Technical Indicators: The current trend is strongly bullish, supported by moving averages, but caution is advised due to overbought conditions indicated by the Stochastic indicators, potentially signaling a short-term correction.
Sector Analysis
Since the market is trending upwards, most sectors are likely to record gains. However, not all sectors offer the same level of saf koety. Sectors that are technically weak often give up their gains quickly during market pullbacks. To protect your investments and manage downside risk, focus on sectors exhibiting clear technical strength—characterized by consistent higher highs and lows, along with strong relative strength.
Use the table below to quickly identify which sectors are currently strong, neutral, weak, or very weak.
Strength of Indices
| Indices | Strength |
| Nifty 50 | Strong |
| Nifty Midcap 150 | Strong |
| Nifty Smallcap 250 | Weak |
| Nifty Microcap 250 | Very Weak |
Sectoral Strength
| Sector | Strength |
| Private Bank | Strong |
| PSU Bank | Strong |
| Financial Services | Strong |
| PSU | Strong |
| Automobile | Strong |
| Electric Vehicle | Strong |
| Commodities | Strong |
| Manufacturing | Strong |
| Defence | Neutral |
| Pharma | Neutral |
| Energy | Neutral |
| Oil & Gas | Neutral |
| Infrastructure | Neutral |
| FMCG | Weak |
| Information Technology | Weak |
| Realty | Weak |
| Consumer Durable | Weak |
| Media | Weak |
Note: In an uptrend, prioritize technically strong sectors as they tend to retain gains even during short-term corrections. Neutral sectors can be used selectively, but exposure to weak or very weak sectors should be limited unless you are executing a short-term trading strategy with strict risk management.
Factors Affecting Performance of Nifty 50
Economic Factors
Economic factors like GDP growth, inflation, interest rates, and foreign investment have a profound and interconnected effect on the Nifty 50. The index, which represents the 50 largest and most liquid Indian companies, responds to both domestic and international economic signals.
Gross Domestic Product (GDP)
GDP, a measure of a country’s economic health, has a strong positive correlation with the Nifty 50.
- Strong GDP growth indicates a thriving economy with increased consumption and higher corporate earnings, boosting investor confidence and stock prices.
- A declining GDP, conversely, can lead to negative investor sentiment and market downturns as businesses and individuals spend less.
- Studies have historically shown that Indian stock market indices can grow at two to two and a half times the rate of GDP growth.
Interest rates and monetary policy
The Reserve Bank of India (RBI) controls monetary policy, and its decisions have a powerful influence on the Nifty 50.
- Rising interest rates: When the RBI raises interest rates (like the repo rate), borrowing becomes more expensive for companies and consumers. This can reduce corporate profits and slow down consumer spending, putting downward pressure on the stock market.
- Falling interest rates: A reduction in interest rates makes borrowing cheaper, which can spur business investment and consumer spending. This typically boosts corporate earnings and drives stock prices higher.
- Sector-specific effects: Interest rate-sensitive sectors, such as banking, real estate, and automotive, are particularly affected. For instance, a rate cut benefits banks by boosting credit demand, which can lead to higher valuations for financial stocks within the Nifty 50.
Inflation
Inflation, or the rising cost of goods and services, has a complex and varied impact on the Nifty 50.
- Negative correlation: Historically, high inflation has correlated with lower stock market returns because it erodes corporate profits and decreases consumer purchasing power.
- Central bank response: Persistently high inflation often prompts the RBI to raise interest rates, triggering the negative effects mentioned above.
- Sectoral differences: Sectors that can easily pass on higher costs to consumers, like fast-moving consumer goods (FMCG) and healthcare, tend to be more resilient during inflationary periods. In contrast, cyclical sectors dependent on consumer discretionary spending may struggle.
Foreign investment
The flows of foreign capital significantly influence the Nifty 50, particularly due to India’s growing integration with the global economy.
- Foreign Institutional Investors (FIIs): Large-scale buying by FIIs infuses liquidity and boosts market valuations. Conversely, a major sell-off by FIIs can cause substantial market corrections.
- US Federal Reserve policy: The US Fed’s interest rate decisions can impact the Nifty 50. A higher US interest rate can attract capital away from emerging markets like India, leading to FII outflows.
Global events
The Nifty 50 does not operate in a vacuum and is influenced by international events that affect global capital markets and investor sentiment.
- Geopolitical tensions: Conflicts, such as the Russia-Ukraine war, can impact commodity prices, disrupt global trade, and create market uncertainty, prompting risk-averse behavior.
- Global market trends: The performance of major global stock indices, especially in the US and Europe, can impact the Indian market. For example, a strong session on the US markets can lift Indian stocks the next day.
- Crude oil prices: As a major oil importer, India is highly sensitive to fluctuations in global crude oil prices. A sharp rise in oil prices can worsen inflation and affect corporate profits, particularly for oil-dependent sectors, which in turn pressures the Nifty 50.
Political Factors
Political factors that affect Nifty 50 performance include elections, government policies, geopolitical events, and regulatory changes. Market volatility typically increases in the short term due to uncertainty surrounding these political factors, but long-term performance is more closely tied to fundamental economic conditions.
Elections
- Political Stability: A clear election outcome that results in a stable government can boost investor confidence and reduce market volatility, as seen with the NDA wins in 2014 and 2019. Conversely, an ambiguous result or a coalition government can create uncertainty and cause market jitters.
- Policy Expectations: The promises made in a political party’s manifesto regarding taxes, economic reforms, and infrastructure spending influence investor sentiment. Anticipation of pro-business policies can drive up stock prices, while uncertainty or unfavorable policies can lead to sell-offs.
- Investor Behavior: Markets often react to exit polls and actual election results with short-term swings based on initial perceptions. However, historical data shows that markets tend to recover over the long term, adapting to the economic policies of the new government.
Government policies
- Fiscal Policy: The Union Budget and changes in government spending and taxation have a significant impact. Measures like increased infrastructure spending can boost related sectors (e.g., construction and cement), while tax cuts can increase consumer spending and corporate profits. For example, the GST reforms proposed in 2025 positively influenced consumer and auto sectors by cutting levies.
- Monetary Policy: While controlled by the Reserve Bank of India (RBI), monetary policy is influenced by government targets and economic stability goals. Changes in the repo rate affect market liquidity, which can influence stock prices.
- Regulatory Changes: New regulations or modifications by bodies like the Securities Exchange Board of India (SEBI) can directly impact the performance of specific sectors. Tighter regulations, for example, could negatively affect certain industries.
Geopolitical events
- Investor Sentiment: International conflicts, trade wars, and diplomatic tensions create global uncertainty that can lead to market disruption and fluctuations. For example, the US-China trade tensions have caused uncertainty in global markets.
- Commodity Prices: Geopolitical events can affect commodity prices, such as crude oil. As a major oil importer, India’s stock market is sensitive to oil price volatility, which can lead to inflationary pressures and higher costs for companies.
- Historical Impact: The Indian market has shown resilience in the face of geopolitical tensions, with market dips often followed by a recovery over the long term, as seen after the Kargil war, Mumbai attacks, and Galwan Valley clash.
Other political risks
- Social Unrest: Riots or political turmoil within the country can increase investor anxiety, create instability, and lead to reduced stock valuations.
- Leadership and Ideology: A leader’s image and a government’s perceived commitment to economic reforms or a pro-growth agenda can significantly affect market sentiment and attract or deter foreign investment.
Also Read


Views of Analysts, Domestic and Foreign Institutional investors on Nifty 50 in short, Medium and long term
Current analysis of the Nifty 50 indicates a bullish outlook for the short and long term, supported by robust domestic inflows, but facing near-term resistance and potential volatility from Foreign Institutional Investors (FIIs).
Short-term view (Analysts and Investors)
- Bullish momentum: Several analysts note the Nifty trading comfortably above key moving averages like the 21-EMA, reinforcing a bullish bias.
- Key levels and targets: Near-term resistance is seen around 25,400–25,500, with a decisive break opening the path to 25,600 or higher. Immediate support is at 25,200. A “buy on dips” strategy is widely recommended.
- FII influence: While the recent return of FIIs turning into net buyers has boosted sentiment, there is lingering caution about whether these inflows will be sustained. Historically, heavy selling by FIIs has often been followed by periods of buying, but global factors can quickly reverse this.
- DII resilience: Strong and consistent buying by Domestic Institutional Investors (DIIs) has absorbed previous FII sell-offs, providing stability and support during market corrections.
Medium-term view (FIIs and Analysts)
- Cautious optimism from FIIs: Many FIIs pulled out significant capital earlier in 2025 due to concerns over high valuations, a cyclical earnings slowdown, and global economic uncertainties. However, improving macroeconomic conditions, such as moderating inflation and the prospect of US interest rate cuts, are shifting sentiment. Analysts expect FIIs to increase their exposure meaningfully in the second half of fiscal year 2026.
- Technical outlook: While some technical indicators suggest a negative signal for the medium term, a sustained breakout above 25,450 could open the door for higher targets around 26,267 or beyond.
- Earnings recovery: A key driver for the medium term will be the expected broad earnings recovery starting from the third quarter of fiscal year 2026, with sectors like BFSI, IT, metals, and consumption expected to lead the way.
- Sectoral focus: Analysts note that FIIs are making focused bets on sectors, particularly favoring financial services, capital goods, and telecom.
Long-term view (DIIs and Analysts)
- Structural bullishness: The long-term outlook for the Indian market remains overwhelmingly positive, with the consensus being a continued uptrend. India is viewed as a compelling long-term destination due to robust economic growth, structural reforms, and strong domestic demand.
- Dominant DII flows: The increasing dominance of DIIs, fueled by strong and resilient domestic mutual fund and SIP inflows, is seen as a key factor providing stability and long-term support to the market. DIIs have consistently used corrections as buying opportunities.
- FIIs’ evolving role: While FIIs have historically been the dominant market force, their influence has lessened due to DII strength. FII flows are now more sensitive to global factors like US interest rates and can cause short-term volatility, but India’s macroeconomic stability continues to attract long-term foreign interest.
- Long-term targets: Some analysts project the Nifty to reach targets above 26,000 by March 2026 and see a “buy-on-dips” strategy as likely to prevail over the long term.
Key takeaways
- Short-term: Watch for a breakout or correction around the 25,500 resistance level. Bullish momentum is currently dominant, but volatility is a risk.
- Medium-term: FIIs are turning cautiously optimistic, anticipating improved earnings and favorable global conditions. Sustained momentum will require corporate earnings to recover as expected.
- Long-term: The market’s structural foundation is strong, backed by India’s robust domestic economy and the stabilizing influence of DIIs. The long-term outlook is firmly bullish despite potential short-term volatility.
Conclusion
In summary, the Nifty 50 closed with notable movements across several key sectors today. Investors observed mixed trends, with some sectors showing strong momentum while others faced resistance. It is important to monitor critical support and resistance levels closely, as they can guide short-term trading decisions and risk management. Additionally, staying informed about sector-wise performance, macroeconomic developments, government policies, and global market cues can provide a broader perspective on potential market direction. Traders and investors should combine these insights with their own research and strategy to make well-informed decisions. Regularly reviewing market trends and keeping an eye on technical indicators can help in identifying opportunities and managing risks effectively.
Frequently asked questions (FAQ)
1. What is the Nifty 50 index?
The Nifty 50 is a benchmark index representing the top 50 companies listed on the National Stock Exchange of India, reflecting overall market performance.
2. How are support and resistance levels determined?
Support and resistance levels are identified using technical analysis tools like trendlines, moving averages, and historical price data to gauge potential price movement limits.
3. Which sectors are currently performing best in the Nifty 50?
Sector performance varies daily; typically, PSU, Automobile, Financials are closely monitored. This article provides a sector-wise snapshot of the day’s performance.
4. Does Nifty 50 analysis guarantee returns?
No. Market analysis provides insights based on historical and current trends but cannot guarantee future returns. Investments carry inherent risks.
5. How often is Nifty 50 updated?
Nifty 50 values update in real-time during trading hours on the NSE. Technical and sector analysis is usually done daily for actionable insights.
6. Can I rely solely on this analysis for trading?
This analysis is meant for informational purposes. Traders should combine it with their own research, risk assessment, and professional guidance before making decisions.
Disclaimer
All information provided in this article is for educational and informational purposes only. It should not be considered as financial advice or a recommendation to buy or sell any securities. Investors should conduct their own research or consult with a qualified financial advisor before making investment decisions.