Nifty Prediction for 26, 27, 28 November 2025 with Monthly, Weekly and Daily Trends

Introduction to Mid week Nifty Prediction

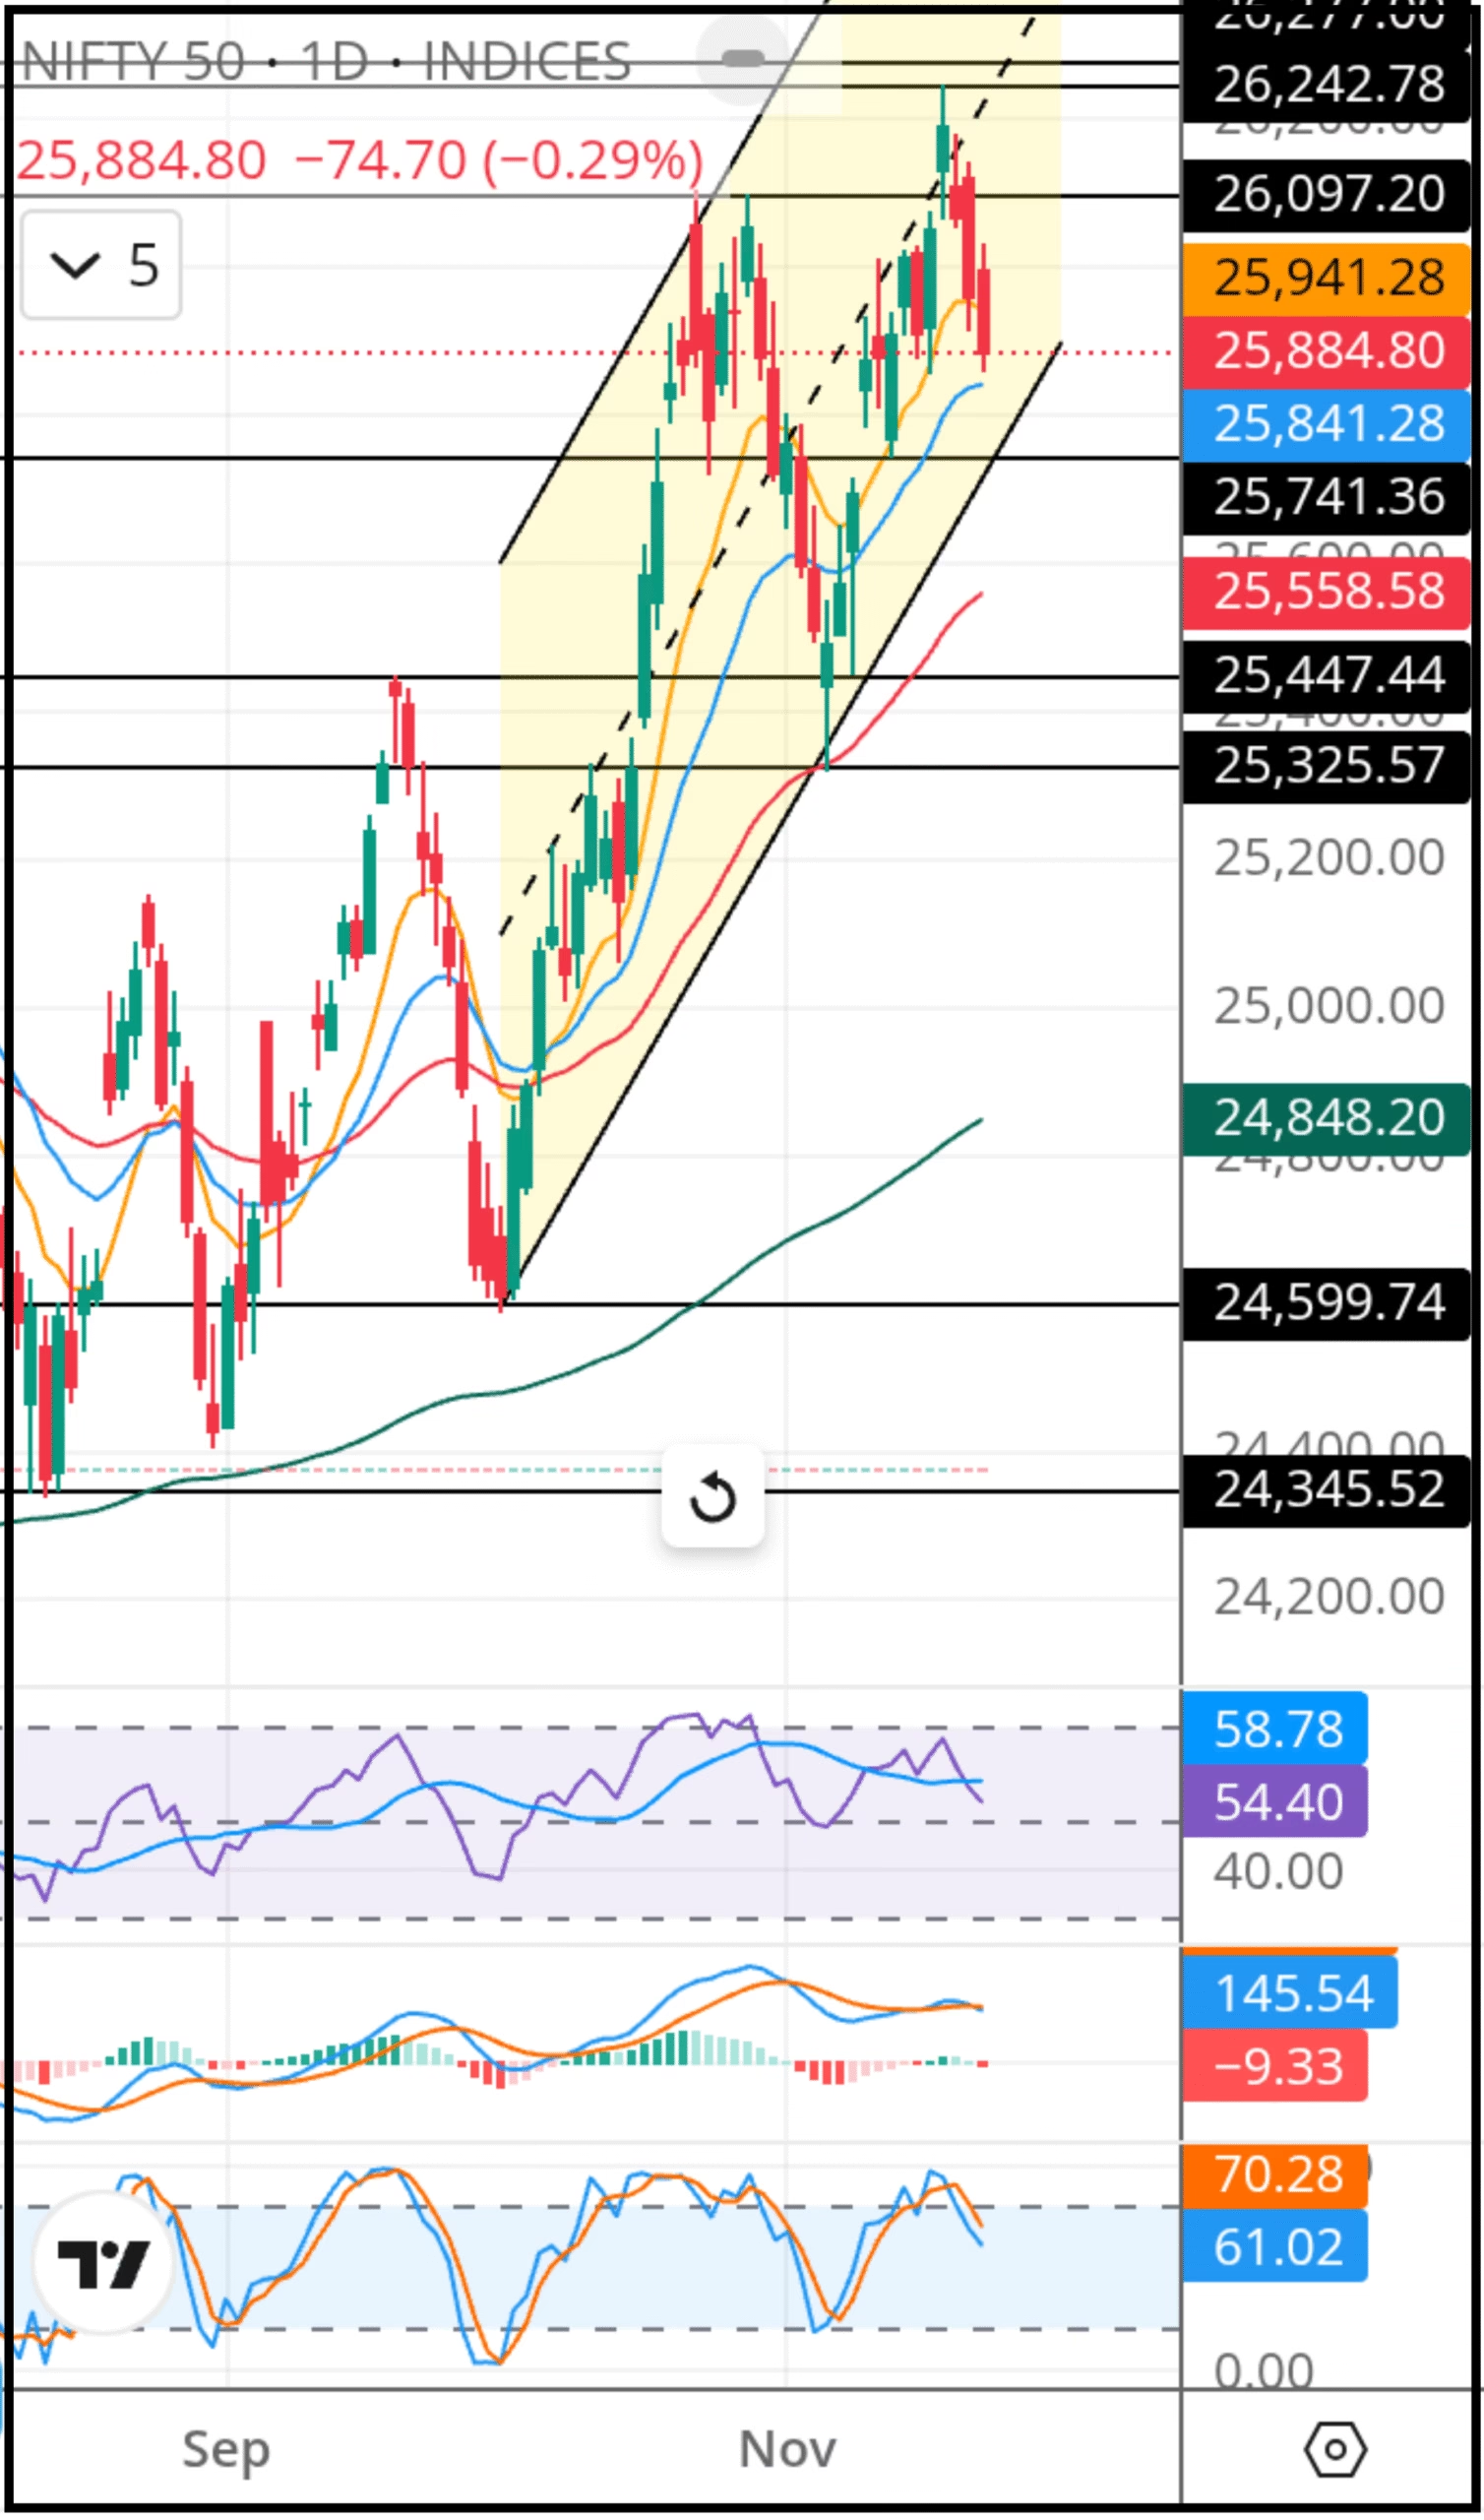
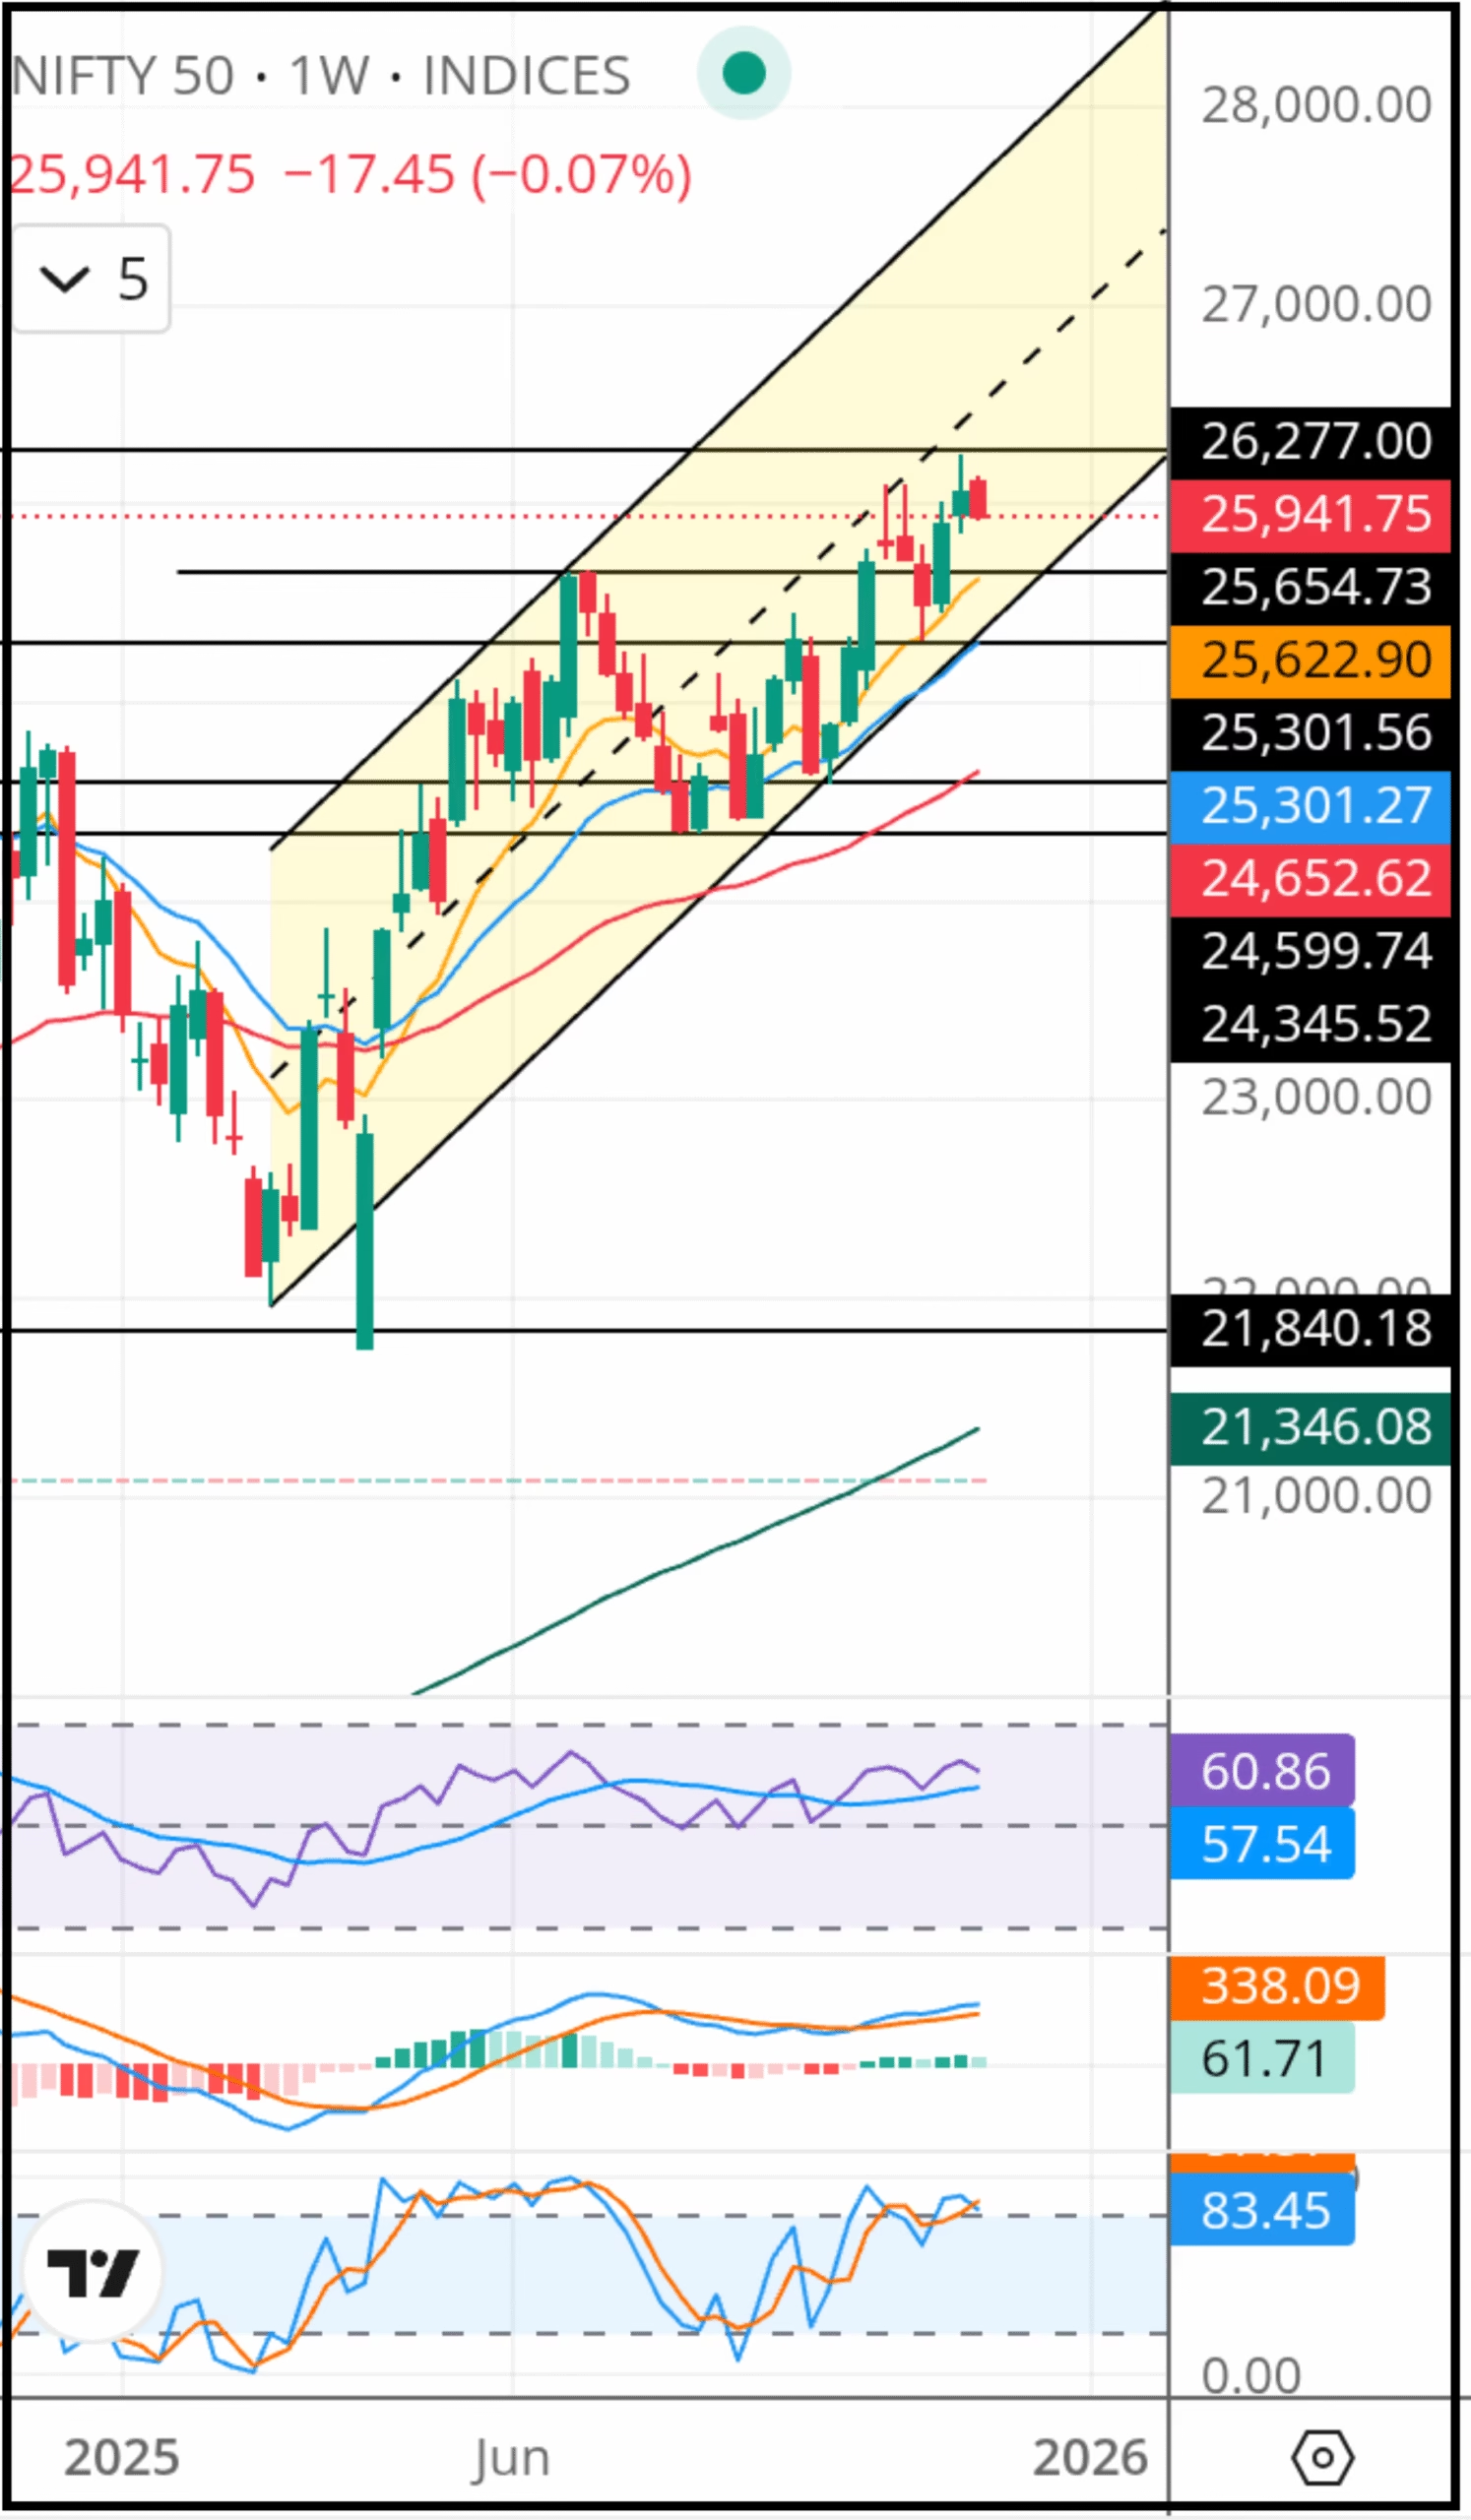
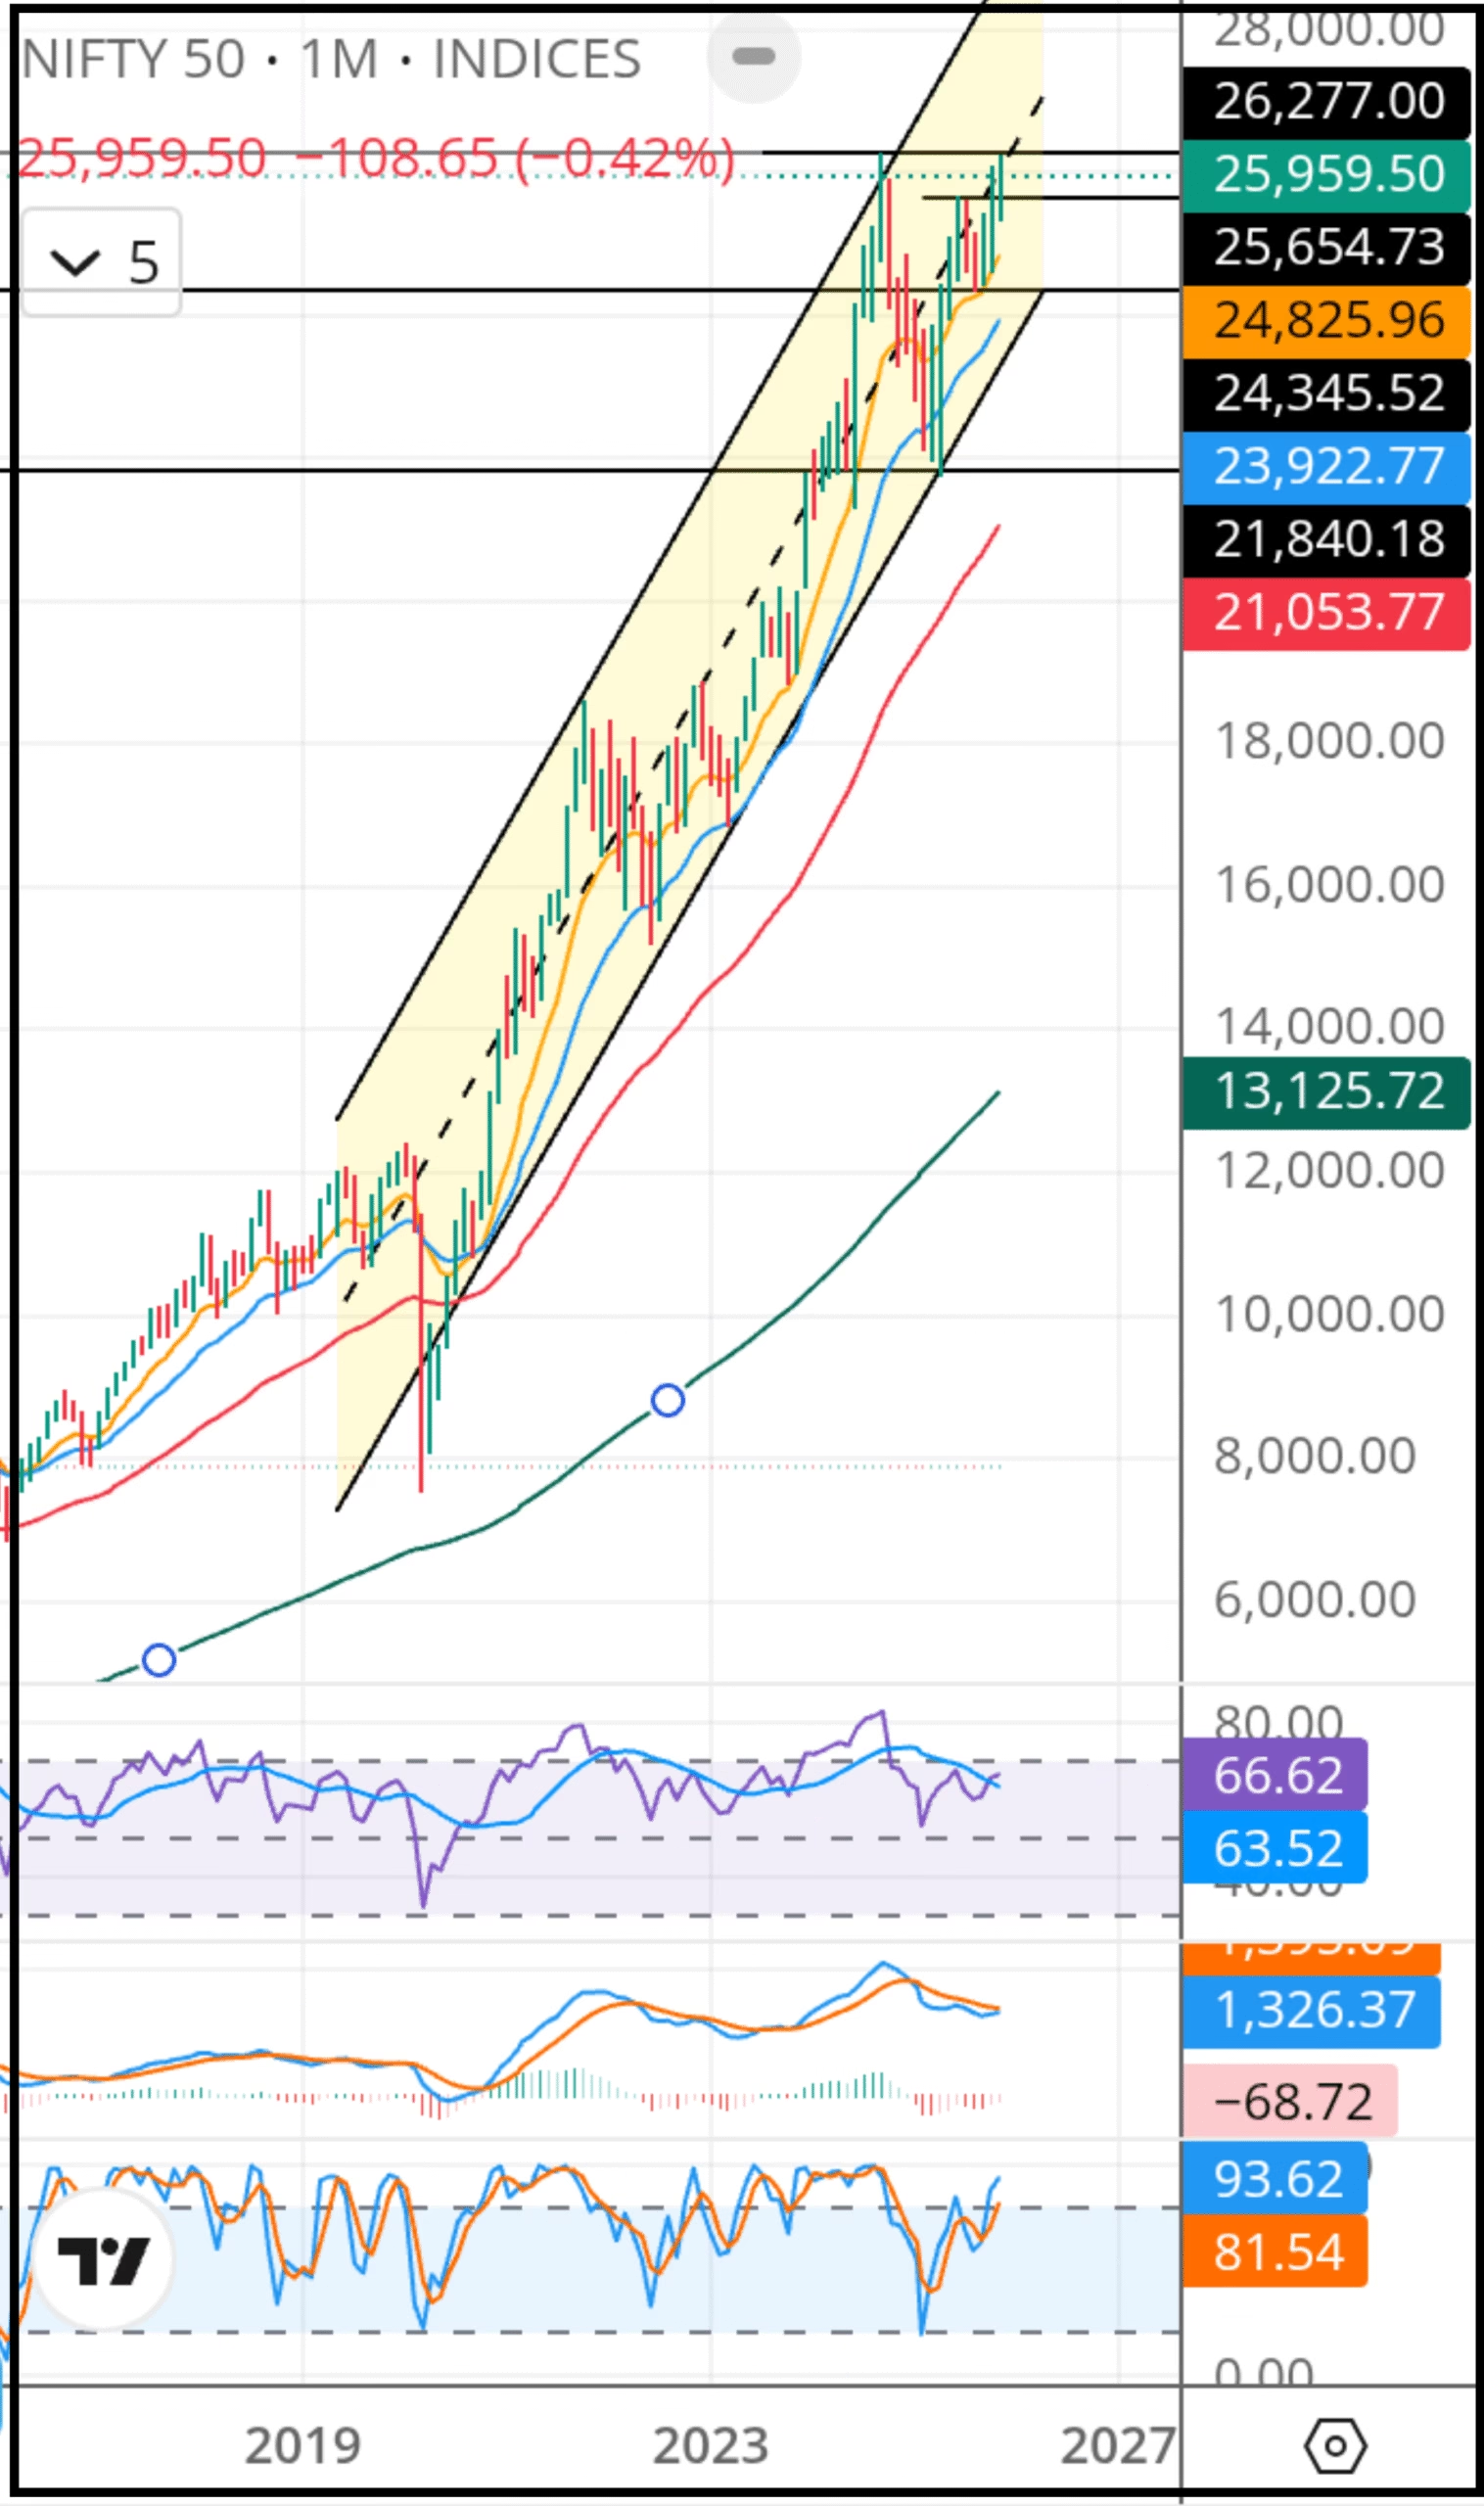
Understanding the Nifty becomes much easier when you combine support–resistance technical analysis with clear short-term trends, intermediate-term trend direction and a structured mid-week analysis. In this report, you get everything in one place — RSI, MACD, Stochastics, interactive chart insights, and a smooth layout featuring 3 tabs: Daily, Weekly, and Monthly performance. This format helps you quickly assess momentum, identify reversal zones, and track how Nifty behaves across multiple timeframes, making your analysis faster and more reliable.

Nifty Prediction: Trade Setup – Daily | Weekly | Monthly

Quick access:

🔹 Nifty Daily Prediction

1. Daily Market Performance Summary

  • Nifty opened at 25,998.5 and closed at 25,884.8
  • Nifty change: − 74.7 points (-0.29%)
  • Strong sectors: Financial Services, Metals, Auto
  • Underperformers: IT, Media,FMCG

Daily Nifty Performance

Open 25,998.5
High 26,032.6
Low 25,857.5
Close 25,884.8
Previous Close 25,959.5
Change -74.70
% Change -0.29

2. Trend Direction

  • Short term trend – Sideways
  • Intermediate term trend – Up
  • Long term trend – Up

Trading Strategy Indicators

Trading Strategy Direction of Trend
Elder Impulse Up
Helkin Ashi Up
Ichimoku Cloud UP
Parabolic SAR UP
Super Trend UP

3. Sector Ranking

  • Very Strong: Auto, Bank, Pharma
  • Weak: IT, Media, FMCG

4. Technical Analysis of Nifty 50

Nifty Daily Chart

5. Chart Interpretation

Chart pattern

  • Nifty is moving between an uptrending channel since mid September 2025

Support and Resistance

Daily Resistance and Support

Resistance 3 26,277
Resistance 2 26,242
Resistance 1 26,097
Close 25,884.8
Support 1 25,741
Support 2 25,447
Support 3 25,325
Resistance
  • If the index breaches 26,097 (closing), expect move toward 26,242
  • If sustained above 26,242, next upside target 26,277
Support
  • If index slips below 25741, next downside test 25,447
  • Further breakdown below 25,447 may drag toward 25,325 (major cushion)

Moving Averages

Exponential Moving Averages (EMAs) on Daily Chart

EMA Periods Value Interpretation
10 Days 25,941 Sell
20 Days 25,841 Buy
50 Days 25,558 Buy
200 Days 24,848 Buy
  • Price below 20 EMA → short-term Bullish
  • Price above 50 EMA → intermediate-term bullish
  • Price above 200 EMA → long-term bullish
  • 20 EMA above 50 EMA → confirms intermediate bullish
  • 50 EMA above 200 EMA → confirms long-term bullish

Indicators

RSI

  • Current RSI (14): 58.78 — above 50 level – Bullish
  • Near the Overbought region → potential short-term pullback
  • Prefer buy on dips until clearer signal

Stochastics

  • Current Stochastics (14): 70.28 — above 50 – Bullish
  • Near overbought → caution for shorts
  • Prefer buy on dips

MACD

  • MACD value: 145.54 — above zero line – Bullish indication
  • MACD line < Signal line: crossover status - Bearish sign

Daily Oscillators

Oscillators Value Inference
RSI 58.78 Sell
MACD Main 145.54 Sell
MACD Signal 154.87 Sell
MACD Histogram -9.33 Sell
Stochastics k% 61.02 Sell
Stochastics D% 70.28 Sell

Technical Outlook

  • Overall outlook: Neutral
  • Oscillators are returning from the Overbought region, so it may slip further
  • Chance of downside correction: High
  • Trading advice: Buy on dips

🔹 Nifty Weekly Prediction

1. Weekly Market Performance Summary

  • Week open:25,948.2, Week close: 26,068.15
  • Week change: +158.10 points (+ 0.61%)
  • Strong sectors: Financial Services, Auto, Metals
  • Weak sectors: Media, IT, Realty

Weekly Performance of Nifty 50 ( week ending 21st November 2025

Open 25,948.20
High 26,246.65
Low 25,856.20
Close 26,068.15
Previous Close 26,910.05
Change +158.10
%Change 0.61

2. Trend Direction

  • Weekly Chart Trend – Bullish

Direction of Weekly Trend By Using Trading Strategy Indicators

Trading System Direction of Trend
Elder Impulse UP
Helkin Ashi UP
Ichimoku Cloud UP
Parabolic SAR UP
Super Trend UP

3. Technical Analysis of Nifty 50 (Weekly)

 Weekly Candlestick Chart of Nifty 50

4. Chart Interpretation

Chart pattern

  • Weekly Chart Pattern : The index is moving in an Uptrending Channel since April 2025 to current date

Support and Resistance

Weekly Resistance and Support

Resistance 3 27,000 (Psychological)
Resistance 2 26,500 (psychological)
Resistance 1 26,277
Close 26,068.15
Support 1 25,301
Support 2 25,000
Support 3 24,599
Resistance
  • If weekly close > 26,277 → next major target 26,500
  • Sustained above 26,500 → longer-term target 27,000
Support
  • If weekly close < 25,301 → downside to 25,000
  • Further break < 25,000 → major support 24,599

Moving Averages (weekly)

Weekly Exponential Moving Averages (EMAs)

EMA Periods Value Inference
10 Weeks 25,622 BUY
20 Weeks 25,301 BUY
50 Weeks 24,652 BUY
200 Weeks 21,346 BUY
  • Price is trading above vs 10, 20, 50, and 200 week EMAs
  • 10 Week EMA is above 20 Week EMA
  • 20 Week EMA is above 50 Week EMA
  • 50 Week EMA is above 200 Week EMA
  • The above set up indicates a strong bullish momentum

Indicators (Weekly)

RSI

  • Weekly RSI (14) value is 60.86
  • RSI is above the 50 level indicates bulls are in control.
  • RSI is near the overbought region, so there is a possibility of pullback.

Stochastics

  • Weekly Stochastics Values : 83.45(K%) and 87.09(D%)
  • Stochastics is above the 50 level indicates bulls are in control.
  • Stochastics is in the overbought region, so there is a possibility of pullback.

MACD

  • Weekly MACD is at 400 and signal line is at 338.09
  • Since signal line is below main MACD line, the market is bullish

Weekly Oscillators

Oscillators Value Inference
RSI 60.86 BUY
MACD Main 400.32 BUY
MACD Signal 338.09 BUY
MACD Histogram 62.00 BUY
Stochastics K% 83.45 SELL
Stochastics D% 87.00 SELL

Technical Outlook (weekly)

  • Weekly outlook: Bullish
  • Investment advice for intermediate term Traders : Hold
  • Risk management : Use Stoploss below 24,301
  • 🔹 Nifty Monthly Prediction

    1. Monthly Market Performance Summary

    • Month open:25,699.85, Month close: 25,969.59
    • Month change: +237.4 points (+ 0.92%)
    • Strong sectors: Financial Services, Auto, Metals
    • Weak sectors: Media, IT, Realty

    Monthly ( November 2025) Market Performance

    Open 25,696.85
    High 26,246.65
    Low 25,318.45
    Close 25,959.50
    Previous Close 25,722.10
    Change +237.40
    Change % +0.92

    2. Trend Direction

    • Monthly Chart Trend – Bullish

    Determining Direction of Trends by Trading Strategy Indicators

    Trading System Monthly Chart Results
    Elder Impulse UP
    Helkin Ashi UP
    Parabolic SAR UP
    Ichimoku Cloud UP
    Super Trend UP

    3. Technical Analysis of Nifty 50 (Monthly)

    Monthly Candlestick Chart of Nifty 50

    4. Chart Interpretation

    Chart pattern

    • Monthly Chart Pattern: The index is moving in an Uptrending Channel since April 2020 (Covid-19 period) to present

    Support and Resistance

    Monthly Resistance and Support

    Resistance 3 27,000 (Psychological
    Resistance 2 26,500 (Psychological)
    Resistance 1 26,277
    Close 25,959.5
    Support 1 25,654
    Support 2 24,345
    Support 3 21,840
    Resistance
    • If monthly close > 26,277 → next major target 26,500
    • Sustained above 26,500 → longer-term target 27,000
    Support
    • If monthly close 25,654 → downside to 24,345
    • Further break 21,345 → major support 21,840

    Moving Averages (Monthly)

    Monthly Exponential Moving Averages

    EMA Periods Value Inference
    10 Months 24,825 BUY
    20 Months 23,922 BUY
    50 Months 21,053 BUY
    200 Months 13,125 BUY
    • Price is trading above 10, 20, 50 and 200 month EMAs
    • 10 Month EMA is above 20 Month EMA
    • 20 Month EMA is above 50 Month EMA
    • 50 Month EMA is above 200 Month EMA
    • The above setup indicates a strong bullish momentum

    Indicators (Monthly)

    RSI

    • Monthly RSI (14) value is 66.62
    • RSI above 50 shows bulls in control
    • RSI near overbought indicates possible pullback

    Stochastics

    • Monthly Stochastics: 93.42 (K%), 81.54 (D%)
    • Above 50 shows bullish strength
    • Currently in overbought zone → pullback possible

    MACD

    • Monthly MACD: 1326, Signal line: 1395
    • Signal above MACD may indicate bearish pressure
    • But MACD often gives unreliable signals at extreme levels

    Monthy Oscillators

    Oscillators Values Comments Final Verdict
    MACD Main Line 1326 Extremely High Level Not Clear/False signals
    MACD Signal Line 1395 Extremely High Level Not Clear/ False signals
    MACD Histogram -68.72 Negative but MACD in extremely High level Not Clear/False signals
    RSI 66.62 Near to Overbought Sell
    Stochastics (K%) 93.62 Overbought Sell
    Stochastics (D%) 81.54 Overbought Sell

    Technical Outlook (Monthly)

    • Monthly outlook: Bullish
    • Investment advice for long-term traders: Hold
    • Risk management: Use stoploss below 24,345

    📌 Final Summary

    • Daily trend: Neutral
    • Weekly outlook: Bullish
    • Monthly bias: Bullish
    • Best approach: Buy on dips

    This post is updated daily after market close.

    Read More

    Tip: If a full page ad opens while navigating, press Back and click again.