

Last Updated : 2nd December 2025, 6.20 pm (IST)
Prediction for Nifty 50
| Nifty 50 formed a Bearish Engulfing pattern in candlestick chart. Support Levels are at 26,000 and 25,850 and Resistance levels are at 26,200 and 26,325. The index is expected to consolidate at current levels.The Nifty declined on December 2, 2025, as traders booked profits after the index touched record highs in the previous session. Sentiment weakened further due to persistent FII selling and a sharp depreciation of the Indian rupee, which hit a new all-time low of 89.97 per US dollar. Banking and financial giants such as HDFC Bank, ICICI Bank, and Axis Bank dragged the index lower, while the pressure extended to the broader market, with both mid-cap and small-cap indices ending in the red. |
Introduction to Nifty Weekly Prediction Series
In this article, you will find a structured, data-driven outlook for Nifty 50. Each section includes:
Welcome to weekly Indian Stock Market Prediction, where we break down the latest movements in the Nifty 50 using a clear mix of support and resistance levels, short-term and long-term trends, and in-depth technical analysis. This report is designed to help traders and investors quickly understand market direction through key indicators such as RSI, MACD, moving averages, chart patterns, and momentum signals.
- Updated support and resistance zones
- Short-term, intermediate-term, and long-term trend analysis
- Detailed technical indicator readings
- Clear analysts’ views for directional bias
- Key factors affecting the Indian stock market, including earnings trends, interest rate expectations, global cues, sector rotations, and macroeconomic data.
This report gives you a complete, easy-to-read snapshot of market strength, volatility, and upcoming possibilities. Let’s dive into today’s Nifty 50 outlook for the coming Week.
Topics of Discussion
Performance of Nifty 50
Weekly Market Performance Commentry
- Daily – On the last trading day of the week, Nifty opened at 26,237.45 and closed at 26204.85 with a loss of 10.7 points (0.04%)
- Weekly – On last Monday Nifty opened at 26,122.80 and closed on Friday at 26,204.85 making a gain of 136.7 points (0.52%)
- Monthly – On 3rd November (Monday) Nifty Nifty opened at 25,696.85 and closed on 28th November (Friday) at 26,204.85 making a gain of 482.75 points (1.88%)
Daily
Daily Performance of Nifty 50
| Open | 26,087.95 |
|---|---|
| High | 26,154.60 |
| Low | 25,997.85 |
| Close | 26,032.20 |
| Previous Close | 26,175.75 |
| Change | -143.55 |
| % Change | -0.55 |
Weekly
Weekly Performance of Nifty 50
| Open | 26,122.80 |
|---|---|
| High | 26,310.45 |
| Low | 25,842.95 |
| Close | 26,204.85 |
| Previous Close | 26,068.15 |
| Change | +136.7 |
| % Change | +0.52 |
Monthy
Monthy Performance of Nifty 50
| Open | 25,696.85 |
|---|---|
| High | 26,310.45 |
| Low | 25,318.45 |
| Close | 26,204.85 |
| Previous Close | 25,722.19 |
| Change | +482.75 |
| % Change | +1.88 |
Trends at a Glance
Table 2 : Snapshot of Nifty 50 Trends
| Time Frame | Chart Used | Trend Direction |
|---|---|---|
| Short Term | Daily | UP |
| Intermediate Term | Weekly | UP |
| Long Term | Monthy | UP |
Trading Strategy Indicators
| Trading Strategy | Direction of Trend |
|---|---|
| Elder Impulse | Up |
| Helkin Ashi | Up |
| Ichimoku Cloud | UP |
| Parabolic SAR | UP |
| Super Trend | UP |
- Short Term Trend of Nifty 50 is Up.
- Intermediate term trend of Nifty 50 is Up.
- Long Term Trend of Nifty 50 is Up.
- Caution : Check if there is a chance of a pull back.
Technical Analysis of Nifty 50
Daily
Combined Technical Outlook - Daily
| Resistance | Value | Support | Value |
|---|---|---|---|
| Resistance 3 | 26,500 | Close | 26,032.20 |
| Resistance 2 | 26,325 | Support 1 | 25,000 |
| Resistance 1 | 26,200 | Support 2 | 25,850 |
| Close | 26,032.20 | Support 3 | 25,700 |
| Exponential | Moving | Averages | (Daily) |
| EMA Periods | Value | Comments | Final Verdict |
| 10 Days | 26,073 | Above Close & Above 20 EMA | SELL |
| 20 Days | 25,966 | Below Close & Above 50 EMA | BUY |
| 50 Days | 25,668 | Below Close & Above 200 EMA | BUY |
| 200 Days | 24,889 | Below Close & Below 50 EMA | BUY |
| Daily | Chart | Oscillators | |
| Oscillators | Value | Comments | Final Verdict |
| RSI | 55 | Neutral | NEUTRAL |
| Stochastics K% | 49.8 | Neutral | NEUTRAL |
| Stochastics D% | 70.56 | Neutral | NEUTRAL |
| MACD Main | 153.37 | Below Signal | SELL |
| MACD Signal | 160 | Above Main MACD | SELL |
| MACD Histogram | -6.37 | Negative | SELL |
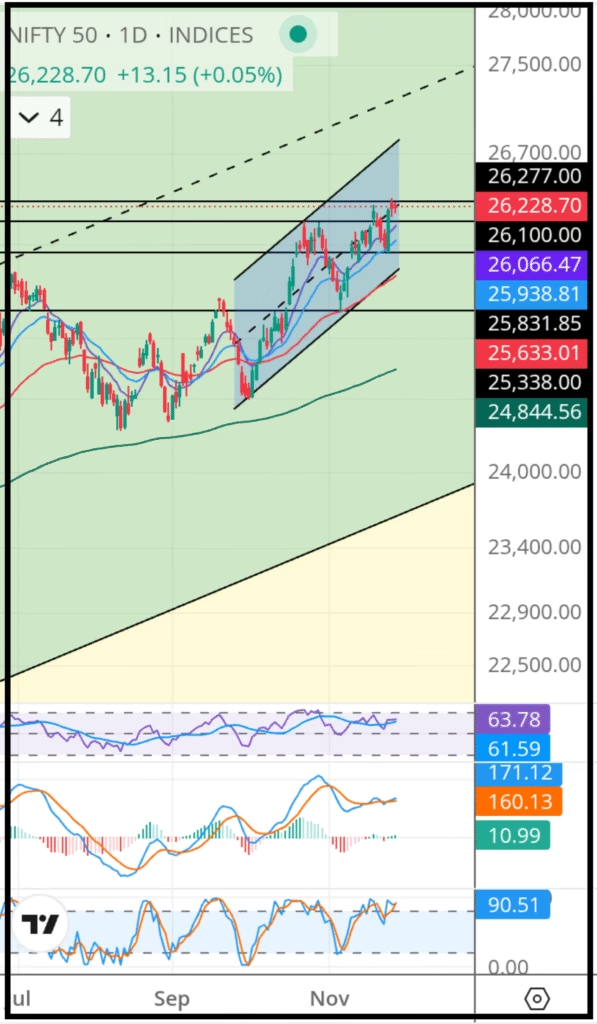
Chart Pattern
- The index is now moving between an upward sloping channel.
- This channel started on 30th September 2025 when Value of Nifty 50 was 24,606
- In two months (October and November) Nifty 50 has gained 1598 points ~ 6.5%. This is a spectator Performance in Short Run.
- On 26/11/2025 ( Thursday – daily chart) Nifty created a bullish engulfing pattern indicating, in the near term Nifty may remain bullish.
Support and Resistance
- The Nifty 50 is currently positioned near multiple resistance levels, marked at 26,200, 26,325 and 26500.
- In the near term, the immediate resistance lies at 26,200.
- If the index successfully breaches 26,200 on a closing basis, we may expect a further upward move toward the next resistance zone at 26,325.
- Should the momentum continue and the index manage to sustain above 26,325, the next potential upside target becomes 26,500
- On the downside, the index has three key support levels placed at 26,000 25,850 and 25,700
- If the index slips below the support at 26,000, the next likely downside test would be the zone around 25,850.
- A further breakdown below 25,850 may drag the index toward the deeper support at 25,700, which is expected to act as a stronger cushion unless a major trend reversal takes place.
Exponential Moving Averages
- The price is currently above the 20 EMA, indicating a short-term bullish trend.
- The price is currently above the 50 EMA, indicating an intermediate-term Bullish trend.
- The price is currently above the 200 EMA, indicating a long-term bullish trend.
- Additionally, the 20 EMA is above the 50 EMA, which confirms a bullish intermediate trend.
- The 50 EMA is above the 200 EMA, which confirms a bullish long-term trend.
RSI
- The current RSI (14) value is 55.00 . Since the RSI is above the 50-level threshold, market momentum currently favors the bulls.
- The indicator is in neutral zone , which suggests a lack of momentum .
- Traders should exercise caution and avoid initiating aggressive short positions at this stage.
- Instead, the preferred strategy is to buy on dips until the indicator confirms a clearer trend direction.
Stochastics
- The current Stochastics (14) value is 49.81. Since the Stochastics is below the 50-level threshold, market momentum currently favors the bears.
- The indicator is in the neutral zone, which suggests a potential lack of momentum
- Traders should exercise caution and avoid initiating aggressive short positions at this stage.
- Instead, the preferred strategy is to buy on dips until the indicator confirms a clearer trend.
MACD
- The MACD value is currently 153, which is above the zero line. This indicates that the market is presently under the control of the bulls .
- Additionally, the MACD line (black) is below the signal line (red), which further confirms a bearish momentum shift. As long as this crossover remains intact, the prevailing down trend is expected to continue.
- MACD histogram is in negative Territory and generating red bars. This indicates bearish momentum is intact.
Weekly
Combined Technical Outlook - Weekly
| Resistance | Value | Support | Value |
|---|---|---|---|
| Resistance 3 | 27,000 | Close | 26,204.85 |
| Resistance 2 | 26,500 | Support 1 | 26,000 |
| Resistance 1 | 26,310 | Support 2 | 25,686 |
| Close | 26,204.85 | Support 3 | 25,338 |
| Exponential | Moving | Averages | (Weekly) |
| EMA Periods | Value | Comments | Final Verdict |
| 10 Weeks | 25,676 | Below Close & Above 20 EMA | BUY |
| 20 Weeks | 25,329 | Below Close & Above 50 EMA | BUY |
| 50 Weeks | 24,664 | Below Close & Above 200 EMA | BUY |
| 200 Weeks | 21,349 | Below Close & Below 50 EMA | BUY |
| Weekly | Chart | Oscillators | |
| Oscillators | Value | Comments | Final Verdict |
| RSI | 64.37 | Near Overbought | BUY |
| Stochastics K% | 96.21 | Overbought | SELL |
| Stochastics D% | 96.82 | Overbought | SELL |
| MACD Main | 423.46 | Above Signal line | BUY |
| MACD Signal | 342.82 | Below Main Line | BUY |
| MACD Histogram | 80.64 | In Positive Territory | BUY |
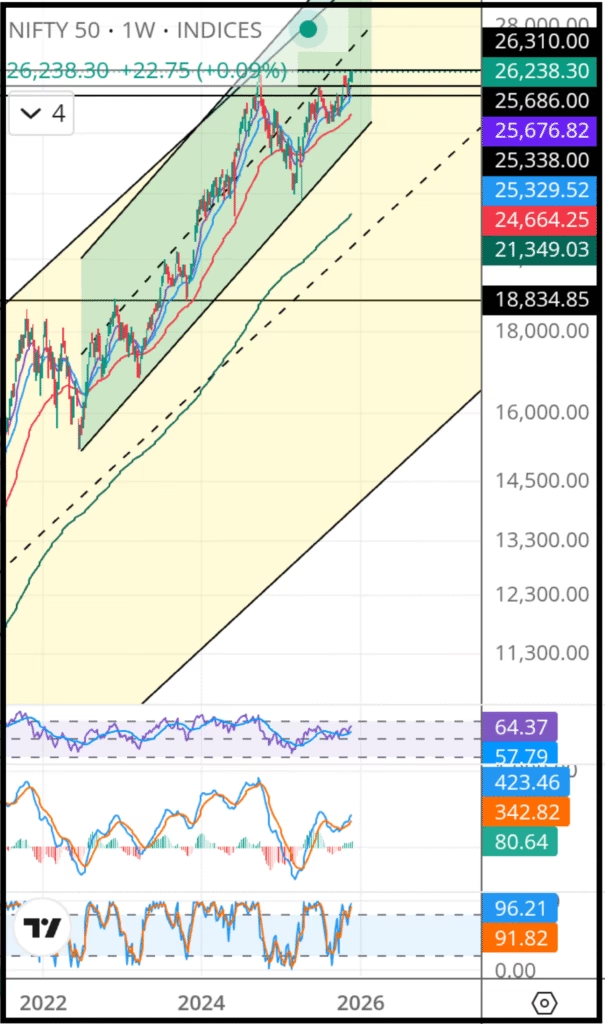
Chart Pattern
- The index is now moving between an upward sloping channel.
- This channel started on 13th June 2022 when Value of Nifty 50 was 15,183
- In nearly two and half years (2022 June to the current date ) Nifty 50 has gained 11023 points ~ 72.6%. This is a spectator Performance in Intermediate Term.
- I last 13 weeks Nifty gained in 9 weeks
Support and Resistance
- The Nifty 50 is currently positioned near multiple resistance levels, marked at 26,310, 25,500 and 27,000.
- In the near term, the immediate resistance lies at 26,319.
- If the index successfully breaches 26,319 on a closing basis, we may expect a further upward move toward the next resistance zone at 26,500.
- Should the momentum continue and the index manage to sustain above 26500, the next potential upside target becomes 27,000.
- On the downside, the index has three key support levels placed at 26000, 25,586 and 25,338 .
- If the index slips below the support at 26,000, the next likely downside test would be the zone around 25,586.
- A further breakdown below 25,586 may drag the index toward the deeper support at 25,338, which is expected to act as a stronger cushion unless a major trend reversal takes place.
Exponential Moving Averages
- The price is currently above the 20 EMA, indicating a short-term bullish trend.
- The price is currently above the 50 EMA, indicating an intermediate-term Bullish trend.
- The price is currently above the 200 EMA, indicating a long-term bullish trend.
- Additionally, the 20 EMA is above the 50 EMA, which confirms a bullish intermediate trend.
- The 50 EMA is above the 200 EMA, which confirms a bullish long-term trend.
RSI
- The current RSI (14) value is 64.37 . Since the RSI is above the 50-level threshold, market momentum currently favors the bulls.
- The indicator is approaching the overbought zone, which suggests a potential short-term pullback.
- Traders should exercise caution and avoid initiating aggressive short positions at this stage.
- Instead, the preferred strategy is to buy on dips until the indicator cools off and confirms a clearer trend direction.
Stochastics
- The current Stochastics (14) value is 96.4. Since the Stochastics is above the 50-level threshold, market momentum currently favors the bulls.
- The indicator is in the overbought zone, which suggests a potential short-term pullback.
- Traders should exercise caution and avoid initiating aggressive short positions at this stage.
- Instead, the preferred strategy is to buy on dips until the indicator confirms a clearer trend.
MACD
- The MACD value is currently 423.46, which is above the zero line. This indicates that the market is presently under the control of the bulls .
- Additionally, the MACD line (black) is above the signal line (red), which further confirms a bullish momentum shift. As long as this crossover remains intact, the prevailing trend is expected to continue.
- MACD histogram is in Positive Territory and generating green bars. This indicates bullish momentum is intact.
Monthly
Combined Technical Outlook - Monthly
| Resistance | Value | Support | Value |
|---|---|---|---|
| Resistance 3 | 27,000 | Close | 26,204.85 |
| Resistance 2 | 26,500 | Support 1 | 24,348 |
| Resistance 1 | 26,310 | Support 2 | 21,670 |
| Close | 26,204.75 | Support 3 | 18,834 |
| Exponential | Moving | Averages | (Monthly) |
| EMA Periods | Value | Comments | Final Verdict |
| 10 Months | 24,876 | Below Close & Above 20 EMA | BUY |
| 20 Months | 23,949 | Below Close & Above 50 EMA | BUY |
| 50 Months | 21,064 | Below Close & Above 200 EMA | BUY |
| 200 Months | 13,047 | Below Close & Below 50 EMA | BUY |
| Monthly | Chart | Oscillators | |
| Oscillators | Value | Comments | Final Verdict |
| RSI | 67.63 | Near To Overbought | BUY |
| Stochastics K% | 98.36 | Overbought | SELL |
| Stochastics D% | 83.12 | Overbought | SELL |
| MACD Main | 1,348 | Below Signal Line | Fasle Signal |
| MACD Signal | 1,399 | Above Main Line | Fasle Signal |
| MACD Histogram | -51.11 | In negative territory | Fasle Signal |
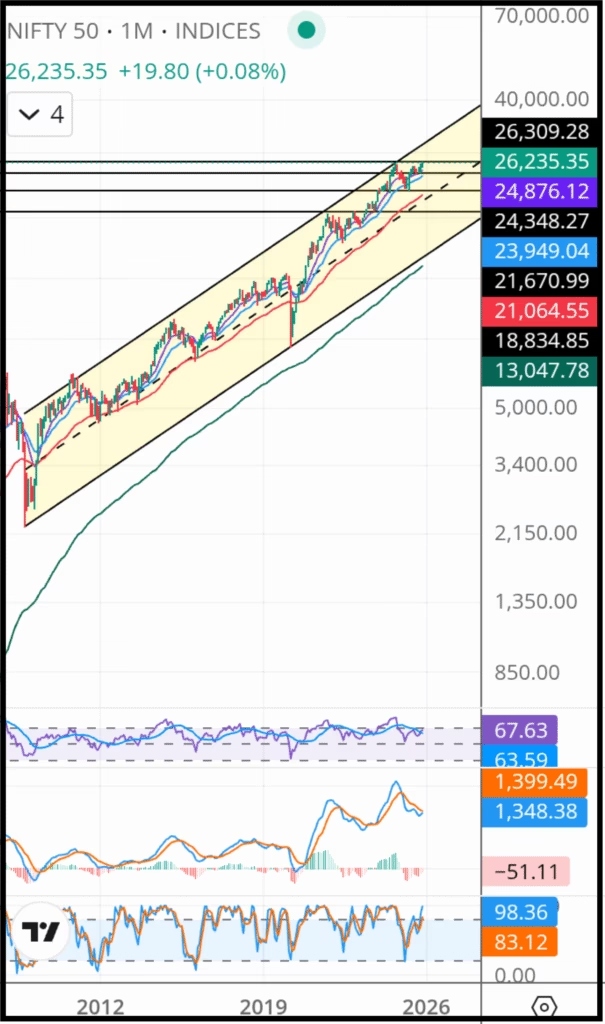
Chart Pattern
- The index is now moving between an upward sloping channel.
- This channel started on 1st October 2008 when Value of Nifty 50 was only 2252.
- In 17 years (2009 to current date) Nifty 50 has gained 23,952 points ~ 1,063%. This is a spectator Performance in Long Run
- In last 9 months, Nifty gained in 7 months.
Support and Resistance
- The Nifty 50 is currently positioned near multiple resistance levels, marked at 26310, 26,500, and 27,000.
- In the near term, the immediate resistance lies at 26,310.
- If the index successfully breaches 26,310 on a closing basis, we may expect a further upward move toward the next resistance zone at 26,500.
- Should the momentum continue and the index manage to sustain above 26,500, the next potential upside target becomes 27,000.
- On the downside, the index has three key support levels placed at 24,348, 21679 and 18,834 .
- If the index slips below the support at 24,348, the next likely downside test would be the zone around 21,679.
- A further breakdown below 21,679 may drag the index toward the deeper support at 18,834, which is expected to act as a stronger cushion unless a major trend reversal takes place.
Exponential Moving Averages
- The price is currently above the 20 EMA, indicating a short-term bullish trend.
- The price is currently above the 50 EMA, indicating an intermediate-term Bullish trend.
- The price is currently above the 200 EMA, indicating a long-term bullish trend.
- Additionally, the 20 EMA is above the 50 EMA, which confirms a bullish intermediate trend.
- The 50 EMA is above the 200 EMA, which confirms a bullish long-term trend.
RSI
- The current RSI (14) value is 67.63 . Since the RSI is above the 50-level threshold, market momentum currently favors the bulls.
- The indicator is approaching the overbought zone, which suggests a potential short-term pullback.
- Traders should exercise caution and avoid initiating aggressive short positions at this stage.
- Instead, the preferred strategy is to buy on dips until the indicator cools off and confirms a clearer trend direction.
Stochastics
- The current Stochastics (14) value is 98.36. Since the Stochastics is above the 50-level threshold, market momentum currently favors the bulls.
- The indicator is in the overbought zone, which suggests a potential short-term pullback.
- Traders should exercise caution and avoid initiating aggressive short positions at this stage.
- Instead, the preferred strategy is to buy on dips until the indicator confirms a clearer trend.
MACD
- Macd is in extremely High level (1348), possibility of false signal is there
- It is better to neglect this Oscillators at this stage
- Especially sell Signal will be generated for the entire bull run.
- So , Traders are advised not to follow MACD and apply to buy in every dip strategy.
Insights : Final Technical Analysis Summary
The overall outlook for the Nifty 50 from 1st to 5th December 2025 remains firmly positive across all timeframes. Technical indicators paint a unified picture: daily, weekly, and monthly trends are all pointed upward, and the index continues to hold comfortably above key moving averages. With all major EMAs rising, the market structure strongly favours the bulls.
At the same time, Stochastics across all charts are approaching or already in the overbought zone, which suggests that short-term pullbacks or brief pauses may occur. However, these signals do not indicate weakness—in a strong uptrend, overbought readings often reflect persistent momentum rather than a reversal signal.
In this environment, analysts maintain a simple and effective strategy:
Buy on small dips, avoid panic during minor pullbacks, and stay aligned with the dominant trend.
Short-term traders should focus on disciplined entries during intraday or swing consolidations, while long-term investors are advised to hold their positions confidently, as the broader trend remains robust and structurally bullish.
Overall, the Nifty continues to move with strength, supported by healthy technicals and resilient sentiment. As long as the index sustains above key support zones, the bullish narrative stays intact for the coming week—and potentially beyond.
Analysts’ View on Nifty 50 Across Timeframes
A Story of Momentum, Caution, and Long-Term Confidence
Picture the Nifty 50 as a traveller on a long journey—sometimes sprinting, sometimes slowing down, but always moving toward a larger destination. Analysts, like seasoned guides, observe every twist of the path: the weather, the terrain, the winds of global markets, and the strength of the traveller itself.
Their views differ depending on how far ahead they’re looking.
Let’s walk through this journey in three phases.
1. Near Term (December 2025) — The Market Riding a Fresh High
As the year inches toward its close, the Nifty 50 stands like a climber who has just touched a new peak but still sees more hills ahead.
Analysts observe the current landscape and say:
- Bullish momentum is alive.
The index has just broken fresh highs, and the energy is still flowing. The bullish breeze is strong enough to carry the market further.
- Next targets on the horizon:
26,500… and if the wind remains favourable, even 26,800.
- Support zones act as the safety net:
The region around 25,800–26,000 is like solid rock beneath the climber’s feet. As long as Nifty stays above this belt, the upward strength remains intact.
- A buy-on-dips mindset prevails.
Many analysts advise: if the market slips slightly, don’t panic—consider it an opportunity. Focus on stocks that look strong on the charts.
- Valuations still reasonable.
Even with new highs flashing across screens, experts say the price is not “too hot to touch.” The market is climbing steadily, not recklessly.
In short, the near-term story is one of confidence—with caution waiting quietly in the background.
2. Medium Term (6–12 Months) — A Journey of Steady but Measured Progress
Move ahead six to twelve months, and the tone becomes more balanced.
The excitement remains, but analysts speak in a calm, measured voice.
- Moderate gains expected.
Supported by strong earnings, sustained domestic demand, and continuous investment flows, Nifty is likely to move forward—slowly but steadily.
- Different analysts paint slightly different pictures for late 2025:
InCred Equities sees a path leading to 27,000 over the next 9–12 months.
Jefferies expects around 26,000 by December 2025, with earlier estimates stretching to 26,600.
Nomura takes a more cautious stance, projecting 23,784, but with a bullish scenario touching 25,700.
- But all agree on the same warning shadows:
High valuations could create occasional fatigue.
US rate volatility may shake the global environment.
Pressure from FPI outflows might slow the pace.
For this part of the journey, analysts suggest sticking to large-caps—the stable, well-anchored travellers—rather than the unpredictable mid-caps.
Long Term (2026 and Beyond) — The Big, Ambitious Destination
When analysts shift to the long view, the story becomes one of optimism, structure, and potential.
The long-term outlook is bright, powered by India’s strong economic engine and policy stability.
- Major firms see impressive milestones ahead:
JP Morgan envisions Nifty touching 30,000 by end-2026, powered by strong fiscal and monetary discipline.
Goldman Sachs, after upgrading India to “Overweight” in Nov 2025, expects the index to reach 29,000 by end-2026.
Goodreturns analysts foresee around 10% gains next year—assuming global rates cool and the investment cycle keeps spinning.
Then comes an even longer horizon—beyond 2026:
Anand Rathi dreams big:
They project Nifty reaching 42,000–54,000 by 2030, reflecting the belief in India’s decade-long growth story.
Why this confidence?
- Structural reforms continue to shape a stronger economy.
- Corporate profits are improving across sectors.
- Consumption is rising, powering domestic demand.
- India’s premium valuation is justified by stable governance and better fundamentals.
- Domestic flows—especially SIPs—act as a rock-solid backbone for the market.
The Long-Term Mantra for Investors
If the journey is long, timing every twist is unnecessary.
Analysts suggest sticking with SIPs, letting the market’s long-term trajectory do the heavy lifting.
Final Thought
From the short-term sprint to the medium-term walk and the long-term marathon, the Nifty 50’s story is one of steady progress—powered by confidence, guided by data, and occasionally slowed by global clouds.
But in every timeframe, analysts agree on one thing:
The Indian market’s long-term story remains one of strength and opportunity.
A Story of How the Market Thinks, Breathes, and Reacts
Imagine the Nifty 50 as a giant ship sailing through constantly changing waters. Some days the sea is calm, some days the winds are strong, and on other days unexpected storms shake the journey. What drives this ship forward—or slows it down—is not one single force, but a combination of many currents, both visible and hidden.
Let’s walk through the story of these forces.
1. The Economic Winds and Monetary Climate
Every morning, the market wakes up asking one question: “How healthy is the Indian economy today?”
- GDP Growth
When the GDP grows steadily, it’s like the engine of the ship is running smoothly. Companies earn more, consumers spend more, and investors feel confident. As this confidence spreads, the Nifty 50 begins to rise with strength.
- Inflation
But not all days are smooth. When inflation rises too high, the cost of everything increases—fuel, raw materials, daily essentials. This weakens purchasing power and squeezes company profits. The market feels the heat and often steps back.
However, a bit of inflation—just enough—signals that the economy is active and expanding. That kind of warmth helps the market sail ahead confidently.
- Interest Rates (RBI’s Role)
The Reserve Bank of India acts like the lighthouse guiding the ship.
When the RBI lowers interest rates, loans become cheaper, money flows faster, and businesses expand—lifting the Nifty 50.
On the other hand, when rates are hiked, liquidity tightens and companies become cautious. This can apply brakes on the index.
- Corporate Earnings
The companies inside the Nifty 50 are the crew members running the ship. If they perform well—posting strong earnings, showing better margins—the market rewards them, pulling the index upward. Weak earnings, however, cast doubt and weigh the index down.
- Valuations
Even when everything looks good, the market often checks the “price tag.” If valuations (like the PE ratio) look stretched, it becomes cautious. But after consolidation, when valuations look reasonable again, investors feel it’s the perfect time to board the ship.
2. Investor Mood and Behaviour — The Heartbeat of the Market
Behind every market movement is a simple human element: emotion.
- FIIs & DIIs (The Big Players)
Large institutional investors are like giant waves. When FIIs bring in heavy inflows, the market surges. When they pull out, the market can tremble. DIIs act as stabilisers, often absorbing the shocks.
- Retail Participation
Retail investors—especially through SIPs—form the steady undercurrent supporting the market. Their consistent investments help the Nifty 50 stay stable even when global markets create turbulence.
- Market Sentiment
Sometimes, the market rises not because of data, but because of belief.
And sometimes it falls because of fear, not facts.
Sentiment—built by news, rumours, hopes, and expectations—often decides the short-term journey of the Nifty 50.
3. The Global Ocean — External Forces Beyond Control
The Nifty 50 doesn’t sail alone. It moves in a global ocean where every wave can affect it.
- Global Market Performance
When US markets like the Dow Jones or S&P 500 perform strongly, confidence spreads across the world. Indian markets follow the trend. But when global giants stumble, the Nifty 50 feels the shockwaves.
- Geopolitical Events
A trade war, a major election, a central bank decision, or global conflict can suddenly change the climate. Investors immediately become cautious, and volatility rises.
- Crude Oil Prices
India imports a large portion of its crude oil. So when oil prices rise, it’s like the ship is suddenly carrying extra weight—costs go up, inflation rises, and market sentiment weakens.
- Currency Exchange Rates
The rupee’s strength or weakness against the dollar tells a separate story. A weaker rupee can hurt companies that rely heavily on imports, but it may help exporters. These shifts influence foreign investment and index movements.
Political Climate and Company-Level Developments
Finally, some factors come from within the ship itself.
- Government Policies & Stability
Elections, budgets, policies, reforms—these shape investor confidence. A stable, growth-oriented policy environment strengthens the market; uncertainty pulls it down.
- Sector Performance
Since the Nifty 50 is a mix of many sectors, a strong rally in banking or IT—its heavyweights—can lift the entire index. Similarly, weakness in these sectors can drag the index down.
- Company-Specific News
A single earnings disappointment from a major Nifty 50 stock… a big merger… a regulatory issue…
These individual stories influence the index instantly because the top companies carry strong weights.
Final Note
The Nifty 50 moves like a dynamic character in a long-running story—sometimes driven by logic, sometimes by emotion, and often by forces far beyond its control. Understanding these factors helps investors read not just the market, but also the narrative behind every rise and fall.
Frequently Asked Questions (FAQ)
1. Is the overall trend of Nifty 50 bullish for the first week of December 2025?
Yes. All major trends—daily, weekly, and monthly—remain bullish. EMAs are rising, price action is holding above key support zones, and market structure continues to favor upward momentum.
2. Stochastics are overbought. Should traders be worried?
An overbought Stochastic in a strong uptrend usually reflects momentum, not weakness. While short-term pauses may occur, the broader trend remains intact. Traders should simply look for minor dips rather than expecting a reversal.
3. What strategy should short-term traders follow this week?
A buy-on-dips approach remains ideal. Since no indicator is showing weakness, traders can focus on pullbacks toward short-term supports and align with the dominant uptrend.
4. Are long-term investors advised to hold?
Yes. With all EMAs pointing upward and long-term charts staying strong, long-term investors should continue holding. The structural trend remains favorable for multi-year growth.
5. What factors are supporting Nifty’s bullish outlook this week?
Strong domestic macroeconomic conditions, steady FII–DII flows, healthy corporate earnings, stable policies, and supportive global cues are helping Nifty maintain its upward trajectory.
6. Can global factors impact Nifty during this period?
Yes. Movements in U.S. indices, crude oil prices, global interest rate trends, and geopolitical developments can influence short-term volatility, even though the current trend is up.
7. What are the key technical indicators supporting the bullish forecast?
All major EMAs are rising, price remains above moving average clusters, Stochastics show strong momentum, and there are no bearish divergences. Together, these confirm sustained strength.
8. How important are support levels in this week’s prediction?
Support zones act as buffers during intraday or daily corrections. As long as the index respects these levels, the bullish trend remains firmly intact. Traders can use supports to identify low-risk entry points.
9. Are valuations a concern at current levels?
Valuations may be elevated but are still within acceptable ranges during strong economic cycles. Consistent earnings growth and domestic inflows justify the current valuation band.
10. How do domestic factors like GDP, inflation, and policy decisions influence Nifty’s outlook?
Higher GDP growth, controlled inflation, stable interest rates, and pro-growth government policies collectively strengthen investor confidence. These domestic fundamentals are key reasons behind Nifty’s sustained upward momentum this week.
Read More


Weekly Close: 26,204.85
(Change: +136.70 points(+0.52%)