
Nifty 50 Ends Higher After US Market Recovery — Midcaps Lead the Charge
On 15th October 2025, the Nifty 50 closed at 25,323.55 rising 0.71%, tracking strong cues from the rebound in US markets.
Sector-wise, Realty, Financial Services (ex-Bank), PSU, PSU Banks, Defence, and Housing stocks led the rally, while Pharma, Private Banks, IT, and Auto sectors posted modest gains.
In market breadth, Midcap indices outperformed Largecap and Smallcap segments, reflecting robust participation from broader markets.
Topics of Discussion
Review of Current Indian Stock Market
Here’s a snapshot of how the major indices closed:
- The Nifty 50 rose 0.71% to close at 25,323.55.
- The Nifty Midcap 150 rose 0.92% to close at 21796.50.
- The Nifty Smallcap rose 0.81% to close at 17,052.00.
Quick Review Table
| Index | Close | %Change |
| Nifty 50 | 25323.55 | 0.71 |
| Nifty Midcap 150 | 21796.50 | 0.92 |
| Nifty Smallcap 250 | 17052.00 | 0.81 |
Also Read


Technical Analysis of Nifty 50
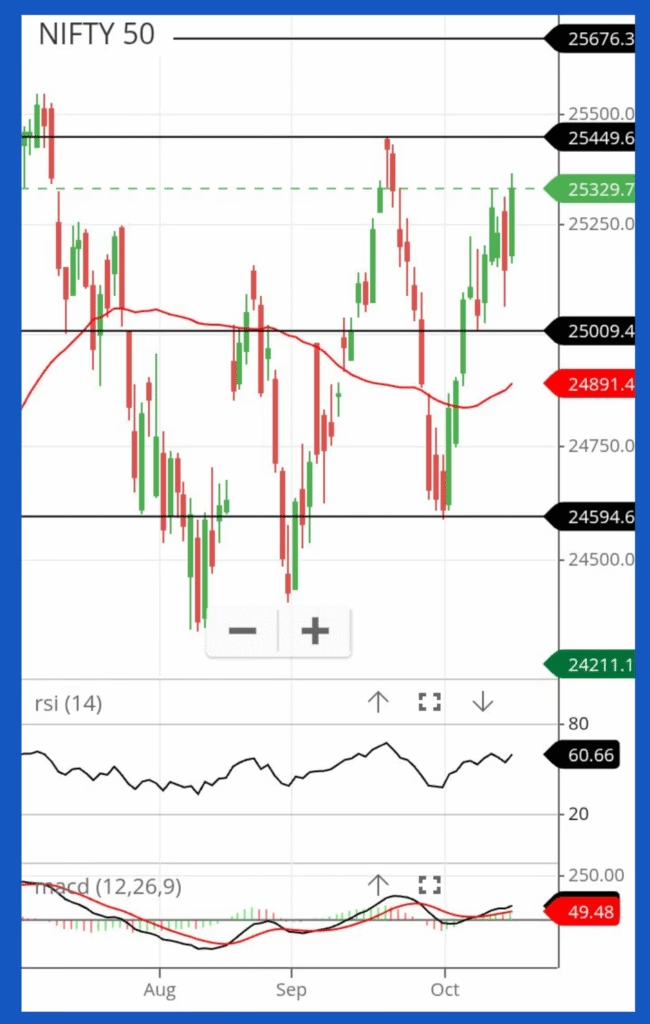
Here is a technical overview of the Nifty 50 index based on data up to October 15, 2025. Please note that technical analysis focuses on past price movements to predict future trends.
Resistances and Supports Table
| Close | 25,284 |
| Resistances | Levels |
| 1 | 25449 |
| 2 | 25990 |
| 3 | 25676 |
| Supports | Levels |
| 1 | 25200 |
| 2 | 25009 |
| 3 | 24594 |
Moving Average Table
| Period (Days) | Simple | Exponential |
| 5 | 25234 | 25216 |
| 10 | 25113 | 25158 |
| 20 | 25072 | 25058 |
| 50 | 24891 | 24991 |
| 100 | 24971 | 24763 |
| 200 | 24211 | 24492 |
Oscillator Table
| Indicator | Vaue | Inference |
| RSI(14) | 60.6 | Buy |
| Stoch (9,6) | 98.95 | Overbought |
| MACD (12,26) | 49.48 | Buy |
| ADX | 13.76 | Neutral |
Insights
- Current Price: 25,323.55 as of October 15, 2025.
- Key Resistance: Resistance is identified in the 25,449-25,990 area. A break above 25,990 could signal further gains towards 25,676.
- Key Support: Failure to breach the resistance levels could lead to a decline towards 25,200. A break below 25,009 would increase selling pressure, potentially pushing the index down to 24594.
- Trading Range: The index is currently experiencing an bullish outlook, likely trading within a range of 25449-25009. A breakout from this range is crucial to determine the next significant move.
- Recent Performance: The Nifty 50 recovered 25,060 on October 14th but then recovered smartly on October 15th.
- Technical Indicators: The current trend is strongly bullish, supported by moving averages, but caution is advised due to overbought conditions indicated by the Stochastic indicators, potentially signaling a short-term correction.
Also Read


Sector Analysis
Since the market is in an uptrend, most sectors will register gains — but that doesn’t mean all sectors are equally safe. A technically weak sector tends to lose its gains quickly when the market pulls back. To preserve gains and reduce downside risk, prefer sectors that show technical strength (consistent higher highs/lows, strong relative strength).
Use the table below to quickly identify which sectors are currently strong, neutral, weak, or very weak.
Strength of Indices
| Indices | Strength |
| Nifty 50 | Strong |
| Nifty Midcap 150 | Strong |
| Nifty Smallcap 250 | Weak |
| Nifty Microcap 250 | Very Weak |
Sectoral Strength
| Sector | Strength |
| Private Bank | Strong |
| PSU Bank | Strong |
| Financial Services | Strong |
| PSU | Strong |
| Automobile | Strong |
| Electric Vehicle | Strong |
| Commodities | Strong |
| Manufacturing | Strong |
| Defence | Neutral |
| Pharma | Neutral |
| Energy | Neutral |
| Oil & Gas | Neutral |
| Infrastructure | Neutral |
| FMCG | Weak |
| Information Technology | Weak |
| Realty | Weak |
| Consumer Durable | Weak |
| Media | Weak |
Note: In an uptrend prefer sectors that are technically strong — they tend to retain gains during short-term pullbacks. Use neutral sectors selectively and avoid heavy exposure to weak/very-weak sectors unless you have a short-term trading plan and strict risk controls.
Factors Affecting the Performance of Nifty 50
Geopolitical, economic, and government policies affect the Nifty 50 by influencing investor sentiment, corporate earnings, and capital flows. External factors can create volatility, while domestic indicators and regulations provide direction for the market.
Geopolitical factors
- Global Conflicts and Tensions: Events like trade wars (e.g., US-China) and regional conflicts (e.g., in oil-producing regions) can disrupt global supply chains and lead to market volatility. This dampens investor confidence and can cause capital flight from emerging markets like India.
- International Trade and Sanctions: Tariffs, trade barriers, or economic sanctions imposed by or on major economies can negatively impact Indian companies with significant international trade exposure. This can weaken investor sentiment and lead to market declines.
- Foreign Investment Flows: The activities of Foreign Institutional Investors (FIIs) and Foreign Portfolio Investors (FPIs) significantly influence the Nifty 50. Global geopolitical instability often prompts FIIs to withdraw from riskier emerging markets, putting downward pressure on the index.
Economic factors
- Global Economic Trends: India’s stock market is deeply integrated with the global economy. Trends such as global inflation, interest rate hikes by central banks (especially the US Federal Reserve), and economic slowdowns in major economies can negatively affect the Nifty 50.
- Domestic Economic Indicators: Key domestic data points, including India’s GDP growth rate, inflation, and industrial production, are vital indicators for the market. A strong GDP and moderate inflation typically boost investor confidence, while high inflation can reduce purchasing power and dampen market sentiment.
- Crude Oil Prices: As a major oil importer, India’s economy is highly sensitive to fluctuations in global crude oil prices. A surge in oil prices can increase inflation and the country’s import bill, negatively affecting the Nifty 50.
- Corporate Earnings: The financial performance of the companies listed in the Nifty 50 index directly impacts its movement. Strong corporate earnings can drive the index upwards, while weak results can cause a decline.
Government policies
- Monetary Policy: The Reserve Bank of India (RBI) controls monetary policy by adjusting interest rates (e.g., repo rate). Lowering interest rates makes borrowing cheaper, stimulating economic activity and potentially boosting stock prices. Conversely, higher rates can slow down economic growth.
- Fiscal Policy: The government’s fiscal policy, including its budget, spending, and taxation decisions, can significantly impact the market. Favorable tax reforms or large-scale infrastructure projects can increase economic growth and investor confidence. Changes to duties or taxes can also affect specific sectors.
- Regulatory Changes: Policies set by the Securities and Exchange Board of India (SEBI) can influence the market. Regulatory changes, such as those affecting index derivatives or trading limits, can increase or decrease market volatility and trading activity.
- Foreign Investment Policy: Government initiatives and policies regarding foreign investment can impact the flow of capital. Efforts to liberalize and attract foreign direct and portfolio investment can provide a significant boost to the market.
View of Investors and Analysts
According to big investors and analysts, the view on the Nifty 50 is cautiously optimistic, with many expecting continued long-term growth driven by strong domestic factors. While some anticipate short-term volatility due to global uncertainty and elevated valuations, the long-term India growth story remains intact.
Positive sentiment and long-term outlook
- Strong domestic inflows: Domestic institutional investors (DIIs) and consistent retail inflows through SIPs are a key pillar of support for the market, offsetting a period of sustained selling by Foreign Institutional Investors (FIIs).
- Economic fundamentals: Analysts generally see strong domestic macroeconomic fundamentals supporting market resilience. For instance, SBI is expected to benefit from India’s robust GDP growth outlook of around 6–6.5%.
- Earnings recovery: Following a period of modest performance, a recovery in corporate earnings is expected to drive the market’s next leg of growth. Some analysts, like those at JPMorgan, project this earnings recovery to push the Nifty higher.
- Supportive government policies: Expected supportive policy actions, including potential rate cuts from the RBI and growth-oriented budgets, are seen as tailwinds for the market.
- Specific sectors of interest: Some analysts highlight sectors like financials, green energy, IT, power, and real estate as offering attractive long-term opportunities.
Potential risks and concerns
- Global headwinds: Broader global uncertainties, such as US-China trade tensions, US Fed policy, and geopolitical issues, can still trigger FII outflows and dampen market sentiment.
- High valuations: After recent rallies, some analysts note that valuations in certain market segments are elevated, leaving little room for error. The high Price-to-Earnings (P/E) ratio, particularly relative to other emerging markets, has been a factor in FII selling.
- Weak earnings: Some brokerage houses have noted a recent decline in corporate earnings and a weakness in the top line, though this is expected to be a temporary phase.
- Consumer demand: While hopeful for a recovery, some investors note that consumer demand has yet to show a strong acceleration, especially in certain sectors.
Nifty target predictions (for context, not certainty)
- Short to medium term: Several analysts have provided targets, with some predicting the Nifty could reach the 27,000–28,000 range by the end of 2025 or early 2026, driven by earnings growth.
- Bull case scenario: In a highly optimistic or bull case scenario, targets of up to 30,000 have been mentioned by some for early 2026, though many find this ambitious in the short term.
- Long term: The long-term India growth narrative remains a key driver of optimism, with some analysts seeing the Nifty continuing to compound at a solid annual rate over the next decade.
Conclusion
The overall market sentiment on 15th October 2025 remained positive, supported by global cues and broad-based buying across key sectors. With midcaps outperforming and cyclical sectors like Realty, PSU, and Defence showing strength, the market outlook continues to favor a short-term bullish bias. However, traders should stay cautious around key resistance levels, as profit booking could emerge after recent gains. From a technical analysis perspective, sustaining above crucial moving averages will be essential for the Nifty 50 to maintain its upward momentum.
Frequently Asked Questions (FAQs)
Why did the Nifty 50 rise on 15th October 2025?
The Nifty 50 gained 0.80% primarily due to positive global cues following a US market rebound and buying in sectors like Realty, PSU, and Financial Services.
Which sectors led the market rally today?
The top-performing sectors were Realty, Financial Services (ex-Bank), PSU, PSU Banks, Defence, and Housing, while IT, Pharma, and Auto showed mild gains.
How did midcap stocks perform compared to largecaps?
Midcap stocks outperformed both largecaps and smallcaps, reflecting strong investor confidence in broader market participation.
What does the technical analysis indicate for Nifty 50?
Technically, Nifty 50 remains in a bullish zone as long as it sustains above key moving averages. A break below support levels may signal short-term weakness.
Is this the right time to invest in the Indian stock market?
Investors with a long-term horizon can continue SIPs or staggered entries, but short-term traders should stay alert to volatility and profit-booking phases.
Will the Nifty 50 trend continue upward this week?
If global markets remain stable and sectoral strength persists, Nifty 50 could maintain its uptrend. However, resistance near recent highs should be watched carefully.
Disclaimer
The information provided above is for educational and informational purposes only. It should not be construed as financial advice or a stock recommendation. Investors are advised to perform their own research and technical analysis or consult a registered financial advisor before making any investment decisions. The author and website are not responsible for any financial losses arising from the use of this information.