Today 10th October 2025 Nifty opened with slightly negative note but market sentiment remained bullish. Key sectors such as Banking, Reality Pharma, and PSUs are leaders in today’s rally, while technical indicators suggest strong support levels and potential resistance zones to watch. Investors are keeping a close eye on short-term trends and sector performance ahead of Monday’s trading session.
Market Overview
Details for Nifty and Sensex , October 10th, 2025:
- The Nifty 50 opened at 25,167.65 and closed at 25,285.25. It reached a high of 25,330.75 and a low of 25,156.85.
- The Sensex opened at 82,075.45 and closed at 82500.82. It reached a high of 82,654.11 and a low of 82,072.93.
Topics of Discussion
Key Market Updates -10th Dec 2025
- Both the Sensex and Nifty snapped a winning streak.
- The Nifty managed to hold above the 25,250 level and closing in the green, while broader markets saw a larger move compared to the benchmarks.
- Large-cap PSU, Reality, Pharma and Bank stocks showed some buying interest.
- Some factors contributing to the market’s activity included Foreign Institutional Investor (FII) buying earlier in the week and global cues like remarks from a Federal Reserve Governor on potential interest rate cuts in the US.
Also Read


TECHNICAL ANALYSIS
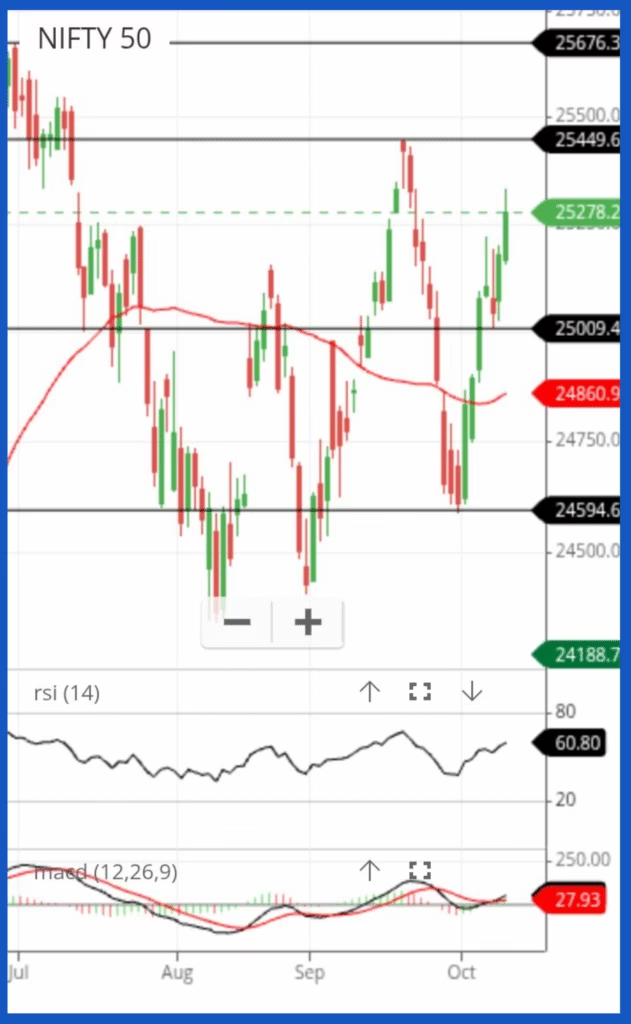
Chart Type & Time Frame
Type: Candlestick chart
Time Frame: 1 Day (each candle represents one trading day)
Index: NIFTY 50
So, each green or red bar (candle) shows the price movement of NIFTY for one day.
Candlesticks
Green candle = Price closed higher than it opened (bullish day).
Red candle = Price closed lower than it opened (bearish day).
The wicks (thin lines) show day’s high and low, while the body shows open and close.
Moving Averages (Red and Green Lines)
You have two moving averages here:
Red line – 50-day moving average (MA50) (medium-term trend).= Currently at 24860
Green line – 200-day moving average (MA200) (long-term trend) =currently at 24188
Note: 200 day moving average is below the chart, so it is not visible but it’s value is written in green at the right side of the chart in green color.
Interpretation:
Price Above MA50 → Intermediate-term trend is strong.
Price above MA200→ Long-term trend is strong.
Crossovers matter:
When red line (MA50) crosses below green (MA200), it’s a bearish crossover (Death Cross).
When red line crosses above green, it’s a bullish crossover (Golden Cross).
Currently, the red MA50 is above the green MA200, but price is fluctuating near it, indicating strength.
Support and Resistance Levels
The black horizontal lines are key support/resistance zones:
Level Type Meaning
Resistances
25676 – 25700 -Resistance Strong supply zone – price previously returned from here.
25449 – 25500 – Resistance Strong supply zone – price previously fell from here.
Supports
25009 – Support : Short Term Support a psychological support level
24594- Support Buyers have defended this level before.
Currently, price is around 25385, just below resistance (25449) — so there may be selling pressure near that area.
RSI (Relative Strength Index – middle panel)
Indicator below the main chart.
RSI = 60.80 (neutral zone).
Range meaning:
Above 70 = Overbought → Possible correction.
Below 30 = Oversold → Possible bounce.
Around 50 = Neutral → Consolidation or sideways market.
👉 Interpretation: Nifty is neither overbought nor oversold. Momentum is balanced.
MACD (Moving Average Convergence Divergence – bottom panel)
Two lines (black and red) and histogram bars.
Black line = MACD line
Red line = Signal line
Reading:
MACD > Signal line → Bullish momentum.
MACD < Signal line → Bearish momentum.
Histogram (green/red bars) shows momentum strength.
Currently, both lines are very close — momentum is gaining strength as crossover is observed.
🔎 7. Overall Technical View
Aspect Observation Meaning
Price vs MA50 – bullish
RSI Neutral (60.8) upward momentum
MACD Flat, near zero gaining momentum
Key Support 2509 If broken → deeper fall possible
Key Resistance 25449 Needs breakout for long term bullish confirmation
In Simple Words
Nifty 50 is currently trapped between 25000(support) and 25500 (resistance).
RSI is showing strength but MACD shows positive momentum — strong trend.
If Nifty closes above 25000, it’s next target is 25449 to 25500.
If it breaks below 25000, it could test 24594.
Insights from the Chart (Bullish Bias):
Despite recent volatility, the Nifty 50 is showing early signs of regaining strength. The index has successfully held above the crucial 25000 support zone and is now attempting to reclaim the 25,449 mark. RSI remains comfortably above the midpoint at 57, indicating that buying momentum is gradually building without entering overbought territory. The MACD, though still flat, is on the verge of a positive crossover — a sign that bullish momentum could soon pick up.
If Nifty manages a decisive close above 25,449, it would confirm a long-term breakout, opening the path toward 25,676 levels. The overall structure suggests a base formation near 25,000, and as long as this support holds, the broader trend remains positive. Dips towards 25,000 can be seen as healthy retracements and potential buying opportunities for medium-term investors.
Sector Watch
Watch sector trends closely — if a sector is currently in a bearish phase, it’s better to avoid fresh investments there. Instead, focus on sectors that are technically showing bullish strength, as they offer better short-term opportunities. Stay patient and wait for clear bullish signals before re-entering the bearish sectors to maximize gains and reduce downside risk.
Market Condition Sector wise:
| Sector | Market Condition |
|---|---|
| Large Cap | Bullish |
| Mid Cap | Bullish |
| Small Cap | Neutral |
| Bank | Bullish |
| Auto | Bullish |
| PSU | Bullish |
| Defence | Bullish |
| Pharma | Bullish |
| FMCG | Bearish |
| Realty | Bearish |
| Media | Bearish |
| Energy | Bullish |
| IT | Bearish |
Also Check


Factors Affecting Performance of Nifty Index
Major policies impacting the stock market and Nifty index in October 2025 include the Reserve Bank of India (RBI) Monetary Policy Committee (MPC) decisions and new Securities and Exchange Board of India (SEBI) regulations. These announcements have boosted market sentiment by signaling economic stability and easing credit conditions, despite global uncertainties.
Government Policies:
Reserve Bank of India (RBI) Monetary Policy
- Repo Rate and Stance: In its October 2025 meeting, the MPC kept the repo rate unchanged at 5.50% and maintained a “Neutral” policy stance. This decision was largely in line with market expectations after a cumulative 100 basis point cut earlier in 2025. The RBI cited benign inflation (2.6% forecast for FY26) and resilient growth (GDP forecast revised up to 6.8%) as key factors.
- Market impact: The RBI’s actions revived market optimism, ending an eight-session losing streak for the Nifty. The index saw strong gains following the announcement, especially in banking and financial stocks, which reacted positively to the measures to ease credit flow.
- Credit flow and financial reforms: The RBI unveiled several measures to improve credit flow and financial market efficiency:
- Acquisition financing: Enabled Indian banks to finance acquisitions by domestic corporates, which is a major boost for capital markets.
- Increased lending limits: Raised the limit for bank lending against shares from ₹20 lakh to ₹1 crore and for IPO financing from ₹10 lakh to ₹25 lakh per person.
- Reduced risk weights: Proposed lower risk weights for non-banking financial companies (NBFCs) lending to high-quality infrastructure projects, which is expected to reduce financing costs.
- ECL framework: Announced a phased implementation of the Expected Credit Loss (ECL) framework for banks and financial institutions, starting in April 2027.
Goods and Services Tax (GST) Reforms
- Next-gen GST reforms: New GST reforms, which came into effect on September 22, 2025, are aimed at reducing taxes on essentials and consumer items. This was celebrated by traders as the ‘GST Bachat Utsav’.
- Market impact: Analysts believe these tax reductions will boost consumer spending and drive up demand for products in sectors like Fast-Moving Consumer Goods (FMCG), automobiles, and consumer durables. Some of this positive impact was already seen in the market bounce back in October.
SEBI market regulations
- Block deals: SEBI introduced new regulations for block deals, increasing the minimum trade size to ₹25 crore to enhance transparency and efficiency.
- Market impact: These regulations are aimed at modernizing the market and building investor confidence, though their direct impact on the Nifty is expected to be part of broader market sentiment.
Other Factors
Fiscal prudence: CareEdge Ratings projects India’s government debt will decline over the next decade, indicating prudent fiscal management and boosting economic growth prospects.
Global Factors
Global factors have a significant influence on the Nifty and Indian stock market, with key drivers including shifts in US interest rate policy, fluctuations in crude oil prices, and broader international market trends. In 2025, the market has reacted sharply to these external forces, leading to periods of both volatility and significant corrections.
US interest rate decisions and FII flows
- September 2025 Rate Cut: The US Federal Reserve’s September 2025 decision to cut its key interest rate by 25 basis points was a notable event. While rate cuts can attract more foreign investment to emerging markets like India, the Fed’s stance has also influenced capital flows.
- FII Outflows: Despite the rate cut, the year has seen substantial withdrawals by Foreign Institutional Investors (FIIs) from Indian markets. These outflows, in part driven by a stronger US dollar, have contributed to market corrections and subdued performance in the Indian stock market during 2025.
Crude oil volatility and its impact
CRUDE OIL VS NIFTY 50 COMPARISON TABLE
| Date | Nifty 50 Price | Crude Oil Price (USD/barrel) |
|---|---|---|
| 2025-10-09 | 25,181.8 | NULL |
| 2025-09-16 | 25,239.1 | 63.82 |
| 2025-08-21 | 25,083.75 | 63.52 |
| 2025-07-29 | 24,821.1 | 69.21 |
| 2025-07-07 | 25,461.3 | 66.49 |
| 2025-06-13 | 24,718.6 | 71.29 |
| 2025-05-22 | 24,609.7 | 61.20 |
| 2025-04-29 | 24,335.95 | 60.42 |
| 2025-04-02 | 23,332.35 | 71.71 |
| 2025-03-07 | 22,552.5 | 67.04 |
| 2025-02-12 | 23,045.25 | 71.24 |
| 2025-01-21 | 23,024.65 | 75.83 |
| 2024-12-30 | 23,644.9 | 70.99 |
| 2024-12-05 | 24,708.4 | 68.30 |
| 2024-11-11 | 24,141.3 | 67.92 |
| Source : Google Finance | ||
- Price Volatility: Crude oil prices have seen volatility throughout 2025, influenced by geopolitical events and OPEC+ decisions. As a large importer of crude, India’s economy is highly sensitive to these price movements.
- Effect on Indian Sectors: Higher crude oil prices increase import costs and domestic inflation, which can negatively affect corporate margins across sectors like aviation, petrochemicals, and FMCG. The Reserve Bank of India (RBI) might react by adjusting interest rates to manage inflation, further impacting market valuations.
- Currency Depreciation: Rising crude prices also increase demand for US dollars to pay for imports, putting downward pressure on the Indian Rupee. A weaker rupee exacerbates inflationary pressures.
Broader international market trends
- Trade Policy Shifts: Changes in international trade policies, including US tariffs and China’s focus on domestic consumption, can impact export-reliant Indian sectors like IT, textiles, and pharmaceuticals.
- Geopolitical Tensions: Ongoing global conflicts and tensions contribute to market volatility and risk aversion among international investors, often leading to capital flight from emerging markets.
- ESG Investment: Globally, there is a growing trend towards Environmental, Social, and Governance (ESG) investing. This is influencing capital allocation decisions, with institutional investors increasingly favoring companies with strong ESG compliance.
Key Insights
The data above and supporting results confirm that global economic factors are having a significant influence on the Nifty and broader Indian stock market sentiment. The inter-connectedness of the global economy means that the Indian market is no longer isolated from international events. Investors must closely monitor US Federal Reserve policies, global crude oil prices, and broader international trends to understand market volatility and make informed decisions. The market’s performance in 2025 has been a testament to this, with global uncertainties driving corrections and influencing FII behavior, while domestic institutional flows have provided some resilience.
Conclusion:
In spite of global economic uncertainties, Nifty continues its bullish trend, driven by India’s robust economic growth and strong government support. With key sectors showing resilience and technical momentum intact, the market outlook remains positive for the week ahead.
Frequently Asked Questions (FAQ)
Q1. What is the short-term outlook for Nifty?
The short-term outlook for Nifty remains bullish as technical indicators show strong momentum and improving market sentiment. Buying interest continues near support zones.
Q3. What is the long-term outlook for Nifty?
The long-term outlook for Nifty remains firmly bullish, with projections of 100,000 levels in the coming years as India’s economic fundamentals and corporate profits expand.
Q4. What global factors are affecting Nifty?
Nifty’s movement is being influenced by global economic cues, U.S. interest rate trends, crude oil prices, and foreign institutional investor (FII) flows. Global sentiment continues to play a major role in market direction.
Q5. How is Nifty expected to open on Monday (13 Oct 2025)?
Nifty is likely to see a bullish opening on Monday, supported by positive global cues and sectoral strength in banking, auto, and PSU stocks.
Q6. Which sectors are expected to perform well next week?
Banking, Auto, and PSU sectors are expected to lead the market next week as technical setups and improving liquidity favor cyclical recovery and sectoral rotation.
Disclaimer
The content available on Smart Investello Research and Analysis (SIRA) is provided for educational and informational purposes only. All articles, charts, analyses, and tools on this platform reflect research-driven insights and the personal opinions of the authors, intended to enhance readers’ understanding of financial markets.
SIRA does not offer personalized investment advice and does not endorse the buying, selling, or holding of any specific stocks, mutual funds, or financial products. The material is meant to help readers gain knowledge about Systematic Investment Plans (SIPs), mutual funds, and stock market trends, and should not replace professional financial guidance.
Investing in equities, mutual funds, or other market-linked instruments carries inherent risks, including the potential loss of capital. Readers are encouraged to independently verify all information and consult a SEBI-registered financial advisor before making any investment decisions.
SIRA and its contributors cannot be held responsible for any financial loss, damage, or inconvenience resulting from the use of the information presented on this site.