

🌟 Introduction: Why Midcaps Are Stealing the Spotlight
In the ever-evolving landscape of the Indian stock market, the Nifty Midcap 150 has started drawing serious attention from investors, traders, and analysts alike. Over the past few weeks, its short-term trend has shown a fascinating mix of strength and volatility, creating both opportunities and caution signals.
On the charts, the index continues to move within a well-defined trendline and ascending channel, offering clear support and resistance zones that traders are actively tracking. Many investors studying the interactive chart have noticed how prices repeatedly bounce from support levels, signaling buying interest, while facing resistance near key psychological points.
From a technical analysis perspective, indicators are painting an intriguing picture:
✅ RSI is hovering around the mid-to-high range, suggesting momentum but hinting at possible overbought conditions
✅ MACD is attempting to form a bullish crossover, strengthening the medium-term outlook
✅ Stochastics show overbought readings, cautioning about potential short-term pullbacks
This blend of signals suggests something important:
👉 In the short term, the index may witness brief corrections
👉 But in the medium term, the trend still leans positive
This has led many analysts to highlight 5 midcap stocks to buy, especially those showing strong fundamentals combined with bullish technical patterns.
Traders love midcaps right now because:
- They offer meaningful price movements
- Their chart patterns respond well to technical levels
- They provide better risk–reward setups compared to large caps
Investors love midcaps because:
- They offer strong growth potential
- Many are transitioning into market leaders
- They sit at the sweet spot between stability and expansion
With technicals aligning and market participation rising, the midcap space has become one of the most exciting areas to watch.
Topics of Discussion
🌱 The Story of Midcap Stocks
Imagine a bustling financial city, filled with towering skyscrapers, rapidly growing construction sites, and tiny startups squeezed between lanes. This city represents the stock market.
On one end stood the giant corporate towers — huge, polished, decades old. These were the large-cap companies, respected, stable, and globally recognized. People trusted them, knowing that even during storms, these towers rarely shook.
On the opposite side were the small, energetic workshops, run by ambitious entrepreneurs. These were the small-cap companies, full of dreams and explosive potential, but also fragile. A single bad decision, a sudden market shift, or a funding problem could shut them down overnight.
And then, in the heart of the city, stood the mid-rise buildings — modern, expanding, well-managed, and buzzing with activity. These were the midcap stocks, neither too big to stop growing nor too small to survive challenges. They represented the perfect balance of stability and growth, attracting investors who wanted both safety and excitement.
High Growth Potential
Midcap companies were like ambitious businesses that had already proven themselves. They had:
✅ a working business model
✅ strong customer base
✅ steady revenue
✅ room to grow much bigger
They ranked roughly between 101st and 250th in the market, not yet among the giants but far beyond the struggling newcomers.
Investors visiting this middle district noticed something special:
These companies were in an expansion phase — opening branches in new cities, launching innovative products, acquiring smaller firms, and increasing their market share.
This gave them something powerful:
👉 Higher growth potential than large-caps
without the extreme uncertainty of small-caps.
⚡ The Personality of Midcap Stocks
If midcaps were a character, they would be:
young enough to be ambitious
strong enough to compete
experienced enough to survive challenges
But like any growing business, they carried moderate risk. Their stock prices could fluctuate more than large-caps, yet they weren’t as unpredictable as small-caps.
Liquidity-wise, investors could buy and sell their shares comfortably — not as easily as large-caps, but far better than tiny small-caps where a single large trade could shake prices.
Interestingly, analysts did not closely follow many midcap companies. This created hidden gems, waiting for smart investors who did their own research.
🌄 Why Midcaps Sometimes Outshine Large-Caps
Back in the city, people noticed something fascinating.
The giant towers (large-caps) looked impressive, but they had limited space to expand. Their growth was slow and steady. They focused more on maintaining their empire than building new wings.
Midcaps, however, were still growing, adapting quickly, and exploring new opportunities.
They could:
✅ respond rapidly to technology changes
✅ adjust to market trends
✅ launch new products faster
✅ enter new regions aggressively
During periods when the economy boomed, midcaps often sprinted ahead, giving higher returns than the big giants that moved slowly.
🛡️ Why Midcaps Can Be Safer Than Small-Caps
Compared to the tiny startups (small-caps), midcaps had already crossed the most dangerous stage:
🚫 they were no longer struggling to survive
✅ they had established business models
✅ better financial strength
✅ more loyal customers
Their stocks still moved up and down, but not wildly like small-caps, where a single news headline could cause panic.
Midcaps also had better liquidity, meaning investors could enter or exit without causing big price changes.
They were like well-managed mid-sized factories — not too vulnerable, not too rigid.
🔍 The Quick Comparison
If the three groups were students:
Large-caps would be the top, stable performers—consistent, predictable, rarely failing.
Midcaps would be the rising stars—already good, improving rapidly, with potential to become toppers.
Small-caps would be the wild innovators—brilliant ideas but uncertain outcomes.
🧭 Summary: Comparison at a Glance
Table 1 : Comparison of Midcap with Largecap and Smallcap Stocks
| Feature | Largecap Stocks | Midcap Stocks | Smallcap Stocks |
|---|---|---|---|
| Growth Potential | Steady, Lower Growth | Higher Growth Potential | Very High Potential (But risky) |
| Risk | Lower Risk | Moderate Risk | High Risk |
| Volatility | Low | Moderate | High |
| Liquidity | High | Moderate | Low |
| Investment Profile | Conservative Investors | Moderate Risk Tolerance | Aggressive, Experienced Investors |
🔥 Why This Matters for You
Now, you may be wondering…
Why is everyone suddenly talking about midcap stocks?
Why are traders marking every support and resistance level, and why are analysts highlighting the Nifty Midcap 150 in their reports?
Because something unusual is happening.
Midcaps are sitting at a rare turning point where both technical and fundamental forces seem to align:
The trendline and channel structure are still intact
Momentum indicators like RSI, MACD, and Stochastics are signaling potential shifts
Market participation in midcaps is rising faster than large caps
This combination doesn’t happen often.
When it does, history shows that midcaps can produce strong short-term moves and, more importantly, powerful medium-term rallies that create wealth quietly before the masses notice.
And here’s the real curiosity:
Many of the upcoming market leaders—the companies that eventually become tomorrow’s large caps—often emerge from this phase.
So the question becomes:
👉 Are we witnessing the early stages of a major midcap cycle?
👉 Will the next big wealth creators come from this segment?
That’s exactly why understanding the story of midcap stocks right now could give you a meaningful edge as an investor.
🎯 Final Message of the Story
In the grand financial city:
Large-caps provide comfort and safety
Small-caps provide excitement and big dreams
But midcaps offer the best balance of strength and growth
For many investors, midcaps become the ideal choice:
👉 enough stability to sleep peacefully
👉 enough growth to build wealth meaningfully
And that’s why the middle district of the stock market continues to attract smart, opportunity-seeking investors who believe in both safety and potential.
Weekly Performance and Trends
The Nifty Midcap 150 index continued to demonstrate resilience during the week ending 14th November 2025, despite minor fluctuations in daily movements. The index opened at 22,409.30 and closed marginally lower at 22,151.15, recording a marginal negative weekly change of -0.81%, which reflects market stability after weeks of steady gains.
From a trend perspective, the Nifty Midcap 150 market sentiment remains positive across all time frames — short-term (daily), intermediate (weekly), and long-term (monthly) charts continue to show an upward trajectory. This sustained uptrend highlights strong participation from Midcap stocks, with investors maintaining confidence in the segment’s growth potential.
As the market heads into the week of 24th to 28th November 2025, the technical structure suggests ongoing strength, though selective consolidation may occur at higher levels. In this analysis, we will examine the technical summary, key patterns, and best stock opportunities within the Nifty Midcap index to identify areas where investors can consider buying on dips or adding quality Midcap names for medium-term gains.
Table 2 : Weekly Performance of Nifty Midcap 150 Index
| Particulars | Value |
|---|---|
| Open | 22409.30 |
| High | 22495.40 |
| Low | 22129.50 |
| Close | 22151.15 |
| Previous Close | 22331.25 |
| Gain | -180.10 |
| Gain % | -0.81 |
Table 3 : Snapshot of Nifty Midcap 150 Trends
| Time frame | Chart used | Trend Direction |
|---|---|---|
| Short Term | Daily | Neutral |
| Intermediate Term | Weekly | Up |
| Long Term | Monthly | Up |
Technical Analysis of Nifty Midcap 150
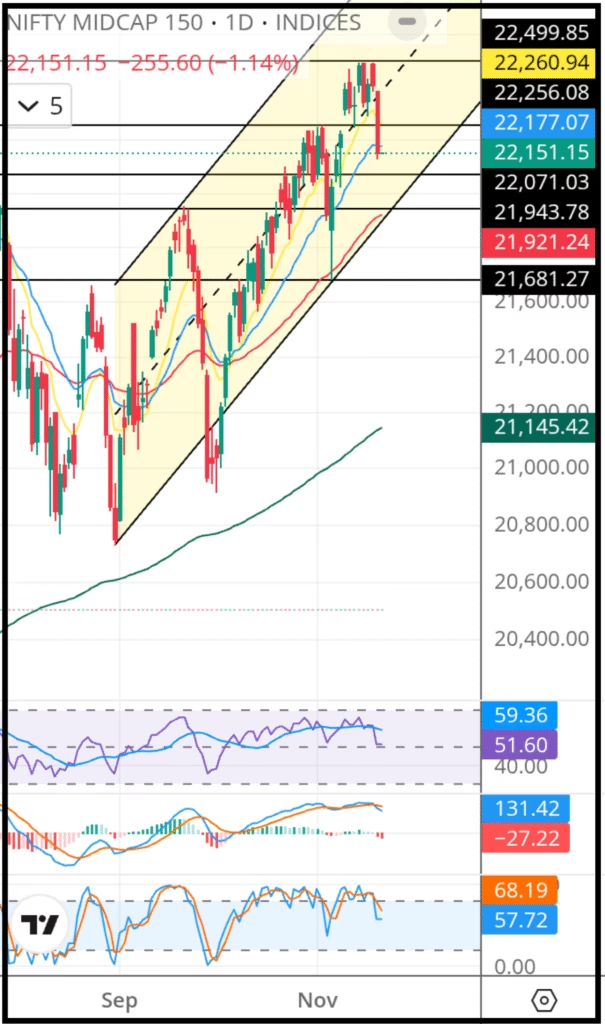
Chart Source : Trading View
Chart Description
Candlestick Chart
This is a daily candlestick chart of the Nifty Midcap 150 index. Details and how to read the chart is shown in the article below

Nifty 50 : Prediction for 10th to 14th November 2025 with Factors Affecting it’s Performance
Nifty 50 weekly analysis: After breaking the 25,686 resistance and crossing 26,000, the index faced a short-term pullback to 25,318. While the intermediate and long-term trends remain bullish,...
Read More →Chart Inference:
Chart Pattern
The Chart shows that the prices are moving between a fixed uptrending channel.
Nifty Midcap 150 is continuously creating higher highs and higher lows since 1st October 2025.
Support & Resistance Commentary
The Nifty Midcap 150 is currently positioned near multiple resistance levels, marked at 22,256, 22,499, and 23000.
In the near term, the immediate resistance lies at 22,256. If the index successfully breaches 22,256 on a closing basis, we may expect a further upward move toward the next resistance zone at 22,499.
Should the momentum continue and the index manage to sustain above 22,499, the next potential upside target becomes 23000.
On the downside, the index has three key support levels placed at 22,071, 21,943, and 21,681.
If the index slips below the support at 22,071, the next likely downside test would be the zone around 21,943.
A further breakdown below 21,943 may drag the index toward the deeper support at 21,681 which is expected to act as a stronger cushion unless a major trend reversal takes place.
Table 4 : Supports And Resistances of Nifty Midcap 150
| Support 3 | 21,681 |
| Support 2 | 21,943 |
| Support 1 | 22,071 |
| Closing | 22,151.15 |
| Resistance 1 | 22,256 |
| Resistance 2 | 22,499 |
| Resistance 3 | 23,000 |
Interpretation of EMAs (20, 50, 200)
The price is currently above the 20 EMA, indicating a short-term bearish trend.
The price is currently above the 50 EMA, indicating an intermediate-term bullish trend.
The price is currently above the 200 EMA, indicating a long-term bullish trend.
Additionally, the 20 EMA is above the 50 EMA, which confirms a bullish intermediate trend.
The 50 EMA is above the 200 EMA, which confirms a bullish long-term trend.
Table 5 : Exponential Moving Averages (EMAs)
| EMA | Value | Comments | Inference |
|---|---|---|---|
| EMA – 10 | 22,260 | Above Close but EMA10>EMA20 | Neutral |
| EMA – 20 | 22,177 | Above Close but EMA20>EMA50 | Neutral |
| EMA – 50 | 21,921 | Below Close and EMA50>EMA200 | BUY |
| EMA – 200 | 21,145 | Below Close and EMA50>EMA200 | BUY |
Interpretation of RSI (14)
The current RSI (14) value is 51.6 . Since the RSI is above the 50-level threshold, market momentum currently favors the bulls.
The indicator is approaching the neutral zone from Overbought region which suggests a potential short-term pullback. Traders should exercise caution and avoid initiating aggressive short positions at this stage. Instead, the preferred strategy is to buy on dips until the indicator confirms a clearer trend reversal.
Interpretation of Stochastics
The current Stochastics (14) value is 57 and 68( Fast and Slow Stochastics). Since the Stochastics is Above the 50-level threshold, market momentum currently favors the bulls.
The indicator is approaching the neutral zone, which suggests a potential short-term pullback. Traders should exercise caution and avoid initiating aggressive short positions at this stage. Instead, the preferred strategy is to buy on dips until the indicator confirms a clearer trend.
Interpretation of MACD
The MACD value is currently 131.42, which is above the zero line. This indicates that the market is presently under the control of the bulls.
But, the MACD line (black) is below the signal line (red), which further confirms a bearish momentum shift. As long as this crossover remains intact, the prevailing down trend is expected to continue.
Table 6 : Indicators
| Indicator | Value | Comments | Inference |
|---|---|---|---|
| RSI | 51.60 | Falling from Overbought | SELL |
| Stochastics | 57 and 68 | Falling from Overbought | SELL |
| MACD | 131.42 | Bearish Crossover | SELL |
Technical Outlook:
Table 7 : Overall Technical Summary
| Object | Comments | Final Verdict |
|---|---|---|
| Trendline | Uptrending Channel | Buy |
| EMAs | Weakness in Short term But Strong Long and Intermediate Trend | Buy |
| RSI | Falling | Sell |
| Stochastics | Falling | Sell |
| MACD | Bearish Crossover | Sell |
| Overall Outlook | Short Pullback before Recovery | Buy in dips |
🔚 Conclusion: A Healthy Pause Before the Next Move
Based on the overall technical summary, the Nifty Midcap segment appears to be entering a classic market phase where short-term weakness is masking underlying strength.
The trendline continues to hold within an uptrending channel, signaling that the broader structure remains positive — a clear Buy indication for trend-based traders. Similarly, the EMAs show temporary weakness in the short term, but both the intermediate and long-term trends remain strong, supporting a continued upward trajectory.
However, momentum indicators are telling a different, more cautious story:
RSI is falling → Sell
Stochastics are declining → Sell
MACD has formed a bearish crossover → Sell
These signals suggest that the market may experience a short pullback, driven by cooling momentum and profit-booking.
But the most important takeaway is the final verdict:
👉 Overall Outlook: Short pullback before recovery – Buy in dips
This means that any near-term correction is likely to be shallow and temporary, offering attractive entry opportunities for investors and traders who believe in the ongoing midcap trend.
With the structural uptrend intact and long-term EMAs supporting the move, the midcap space remains positioned for recovery and continuation once the short-term pressure eases.
✅ Bottom line:
Expect consolidation or a brief decline, but maintain a positive outlook. Use dips strategically rather than fearing them, as the broader trend still favors the upside.
Midcap Stocks to Buy this Week
Given the sustained resilience in Nifty Midcap 150 the following stocks have been selected for the upcoming week.
- BSE Ltd
- Max Financial Services Ltd
- Coforge Limited
- Solar Industries India Limited
- SRF Limited
These stocks represent fundamentally strong, well-managed businesses trading at sensible valuations — the kind of opportunities that align with the long-term investing philosophies of Warren Buffett and Charlie Munger. Each company has the potential to deliver steady compounding over time. Current technical signals, combined with solid fundamentals, further reinforce the constructive outlook for these selections.
📌 “Part of the Nifty Weekly Prediction Package – Click below to explore all predictions”
Read More


Weekly Close: 22,151.15
(Change: -180.10 points(-0.81%)