
Performance of Indian Stock Market On 17th October 2025
The Nifty 50 index broke past a key resistance level at 25,676, advancing 0.48% or 124.55 points to close at 25,709.85 on Friday. The BSE Sensex also extended gains, rising 484.53 points (0.58%) to settle at 83,952.19.
Sectorally, the Nifty FMCG index led the rally with a 1.36% jump to 5,616.40, driven by strong buying in heavyweight constituents Hindustan Unilever and ITC, both of which gained over 1.5%. The FMCG index has now advanced more than 4% over the past three consecutive sessions, reflecting sustained investor interest in defensive sectors.
After the benchmark indices posted moderate gains, attention shifted to the broader market and sectoral performance. The following tables highlight how midcap and smallcap stocks, along with key sectoral indices, performed during the session.
Topics of Discussion
Market Snapshot 17 Oct 2025
| Indices | Close | Gain | Gain% |
| BSE Sensex | 83,952.19 | 484.53 | 0.58 |
| Nifty 50 | 25,709.85 | 124.55 | 0.48 |
| Nifty Midcap 150 | 21,782.80 | -118.10 | -0.53 |
| Nifty Smallcap 250 | 17,076.55 | -40.65 | -0.23 |
Note: For Mobile viewers: Scroll horizontally or better watch in desktop mode
According to the above table, Sensex and Nifty 50 registered gains of 0.58% and 0.48%, respectively. Nifty Midcap 150 closed at 21,782.80 after suffering a loss of 0.53% (118.10 points). Nifty Smallcap 250 ended with a minor loss of 0.23% (40.65 points) and closed at 17,076.55.
The above facts indicates that large cap stocks performed better than Smallcap and Midcap stocks.
Sector Performance on 17th October 2025
| Sector | Close | Gain | Gain% |
|---|---|---|---|
| Nifty FMCG | 56616.4 | 762.5 | 1.36 |
| Nifty Consumer Durable | 39018.55 | 266.45 | 0.68 |
| Nifty Pharma | 22253.75 | 150.55 | 0.68 |
| Nifty Auto | 27228.6 | 179.85 | 0.66 |
| Nifty Fin Serv | 27538.6 | 157.40 | 0.57 |
| Nifty Bank | 57713.35 | 290.80 | 0.50 |
| Nifty Pvt Bank | 28239.95 | 103.65 | 0.36 |
| Nifty Infra | 9338.55 | 33.20 | 0.35 |
| Nifty Ind Defence | 8124.35 | 18.40 | 0.22 |
| Nifty Ind Manufacturing | 15108.60 | 19.60 | 0.12 |
| Nifty Realty | 933.75 | 0.95 | 0.10 |
| Nifty Oil & Gas | 11498.10 | 4.50 | 0.03 |
| Nifty Commodities | 9194.30 | -17.05 | -0.18 |
| Nifty CPSE | 6556.00 | -12.70 | -0.19 |
| Nifty Energy | 35395.10 | -73.10 | -0.20 |
| Nifty Capital Mkt | 4633.35 | -23.00 | -0.49 |
| Nifty PSU Bank | 7638.75 | -50.00 | -0.65 |
| Nifty Media | 1519.60 | -24.10 | -1.56 |
| Nifty IT | 34950.70 | -580.35 | -1.63 |
Note: For Mobile viewers: Scroll horizontally or better watch in desktop mode
Sectoral Performance Summary:
- The FMCG sector emerged as the top performer of the day, posting a strong gain of 1.36%.
- In contrast, the IT and Media sectors were the major laggards, declining by 1.63% and 1.56% respectively.
- Pharma, Auto, and Financial Services sectors managed to register modest gains of around 0.5% each.
- The PSU Bank and Capital Market indices witnessed mild losses, hovering near 0.5%.
- Other sectors remained largely stable with marginal movements.
Market Insight:
Despite the ongoing uptrend in the Nifty 50, a sense of caution persists among investors, as sectoral performance remains uneven. The underperformance of the IT sector, in particular, has emerged as a point of concern, especially amid the current bullish market sentiment.
Weekly and Monthly Performance of Nifty 50
Weekly and Monthly Change of Nifty 50 - 17th October 2025
| Time Frames | Open | High | Low | Close | Gain | Gain% | Consecutive Events |
| Weekly | 25177.3 | 25781.50 | 25060.55 | 25709.85 | 532.55 | 2.11 | 3 Week Up |
| Monthly (October 2025) | 24620.55 | 25781.55 | 24605.95 | 25709.85 | 1089.30 | 4.42 | September & October Up |
Note: For Mobile viewers: Scroll horizontally or better watch in desktop mode
This week, the Nifty 50 opened at 25,177.30 and ended with a strong rise of 2.11% (532.55 points), closing at 25,709.85. During the week, the index recorded a high of 25,781.50 and a low of 25,060.55.
The month of October began with Nifty 50 at 24,620.55, and as of 17th October 2025, the index has gained 4.42% (1,089.30 points), based on the latest closing level of 25,709.85. The monthly high was 25,781.55, while the monthly low stood at 24,605.95.
Why do we Need the Above Table?
Tracking highs and lows provides traders with precise resistance and support levels. On a price chart, these levels are often not clearly distinguishable, making it difficult to identify exact short-term turning points. The following tabular format presents a more refined view of daily, weekly, monthly, and 52-week highs and lows, helping traders analyze and plan their positions with greater accuracy.
Highs and Lows of Nifty 50 - 17th October 2025
| Timeframe | Highs | Lows |
| Daily | 25,781.50 | 25,508.60 |
| Weekly | 25,781.50 | 25,060.55 |
| Monthly (October) | 25,781.50 | 24,605.95 |
| Last 52 Week | 25,781.50 | 21,743.65 |
| All Time | 26,277.35 | Base Value 1000( yr 1996) |
Note: For Mobile viewers: Scroll horizontally or better watch in desktop mode
According to the above table:
Resistances:
The level of 25,781.50 acts as a strong resistance zone for the Nifty 50. If the index successfully breaks above this level, it may move higher to test 26,000 — a key psychological level — or even 26,277.35, which marks the all-time high of the Nifty 50 Index.
Supports:
On the downside, the immediate support lies at 25,508.60. A move below 25,508.60 could push the index toward 25,060.55. If the weakness continues and the index slips further below 25,060.55, the next possible downside target may be around 24,605.95. The final long-term support is placed at 21,743, which serves as a major base for the index.
A Note to Traders:
This method of identifying support and resistance levels is among the simplest and most reliable approaches for traders. It is advisable for traders to note down these key levels in a pocket diary, as Nifty 50 may breach any of them during active market sessions, offering valuable trading opportunities.
📢 An Announcement to All Traders
Before beginning today’s Technical Analysis section, I would like to share a real-life incident that taught me invaluable lessons about trading psychology and simplicity.
It was June 1991, just before the infamous Harshad Mehta Scam. During that time, I used to visit the Calcutta (now Kolkata) Stock Exchange and sit beside my sub-broker Amolda — “Amol” being his name and “da” (meaning elder brother) a term of respect.
Amolda was well-known for his accurate market recommendations — almost 90% of his tips turned out to be correct, even though he never used Technical Analysis. Back then, Technical Analysis wasn’t as popular as it is today.
Curious, one day I asked him,
“Amolda, kaise aap itna sahi prediction karte ho?”
(How do you predict the market so accurately?)
He smiled and replied,
“Bhaw dekh kar. Tum vi koshish karo, tum vi kar sakoge. Ek hi cheez to khojna hai — yaha se ye share badhega ya ghatega.”
(By observing the price. You try it too — you’ll be able to do it. You just have to find one thing — whether the stock will move up or move down from here.)
Even the big market players, especially the Marwari traders from Kolkata’s Bara Bazar (Wholesale Market), would ask him,
“Amol, kya lag raha hai market?”
(Amol, what’s your view on the market?)
From those days with Amolda, I learned some timeless lessons — lessons that remain relevant even in today’s world of algorithms and AI-driven trading.
🧭 Key Lessons I Learned from Amolda
- Keep Your Analysis Simple
Don’t overcomplicate your trading approach with too many indicators. A clean and simple analysis often gives the clearest signals. - Watch the Charts
Before applying any indicators, study the daily, weekly, and monthly charts. Draw your trend lines based on your understanding. Remember — trend lines are actually “friend lines” of a trader. - Always Place a Stop-Loss Order
Every buy order should be accompanied by a stop-loss. The market can change direction at any time — protect yourself first before chasing profits. - Never Overtrade
If your first two trades hit stop-loss, don’t rush to recover small losses. Step away from the market for the day. Trading requires patience, not revenge. - Understand the True Definition of Technical Analysis
Technical Analysis is the process of predicting current price movement based on past price movement — but remember, past movements may or may not reflect the current trend.
Also Read


Technical Analysis of Nifty 50
Recognising Short Term Trend :
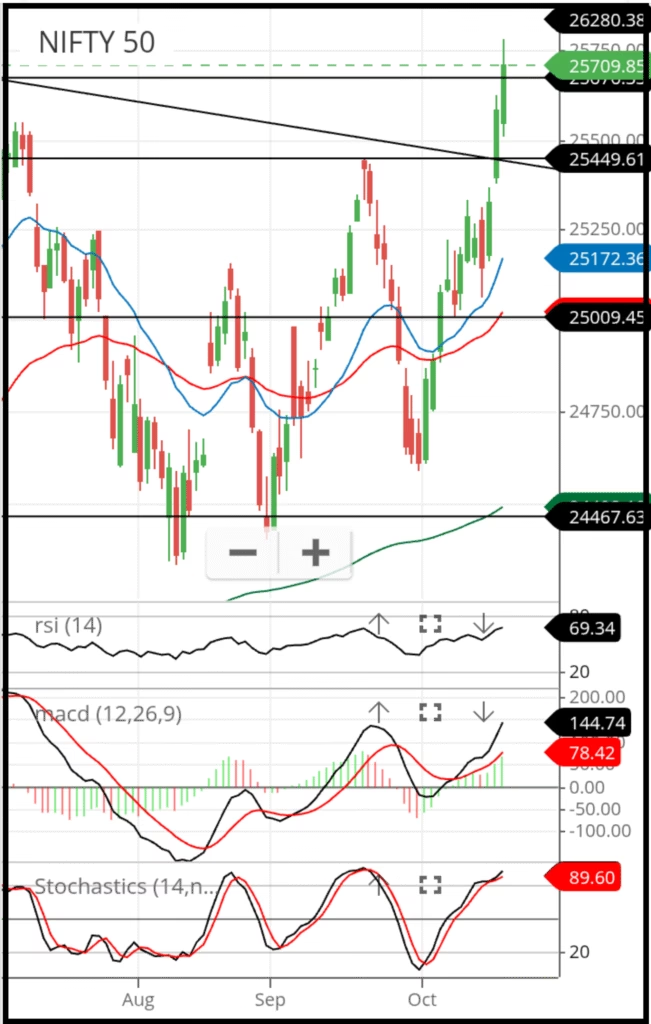
Chart Description
Candlestick Chart
This chart represents a candlestick chart of the Nifty 50 index, plotted using the daily market data of open, high, low, and close prices.
Among all chart types, this one is the most commonly used by active traders to analyze market trends and price behavior.
Candle Body and Wicks
In this chart, each candlestick reflects a single trading day.
Red candles show that the closing price of the day is lower than its opening price.
Green candles indicate that the closing price is higher than the opening price.
The wicks (or shadows) extending above and below the candle represent the highest and lowest prices reached during that trading day.
Moving Averages
Three Exponential Moving Averages (EMAs) are plotted on the chart to help identify market trends and price momentum.
- 20-Day Exponential Moving Average (EMA) – represented by the blue line.
- 50-Day Exponential Moving Average (EMA) – represented by the red line.
- 200-Day Exponential Moving Average (EMA) – represented by the green line.
These moving averages are widely used to determine short-term, medium-term, and long-term trends in the Nifty 50 index.
Trend Lines, Support Lines and Resistance Lines
The chart also includes various black lines to highlight important technical levels:
Horizontal black lines represent support or resistance levels.
Sloping black lines are known as trend lines, which show the general direction of the market—either upward, downward, or sideways.
These lines are essential tools for identifying potential price reversal zones and breakout levels.
Indicators
Beneath the main candlestick chart, there are three technical indicators commonly used for momentum and trend analysis.
1.Relative Strength Index (14) – RSI (14)
The RSI(14) indicator calculates its value based on the closing prices of the last 14 days.
A reading above 70 indicates an overbought condition.
A reading below 30 signals an oversold condition.
The 50 level is considered a neutral zone.
This helps traders gauge whether the index is overextended in either direction.
2. Moving Average Convergence and Divergence (12, 26, 9) – MACD (12, 26, 9)
The MACD consists of two lines:
A black line, which is calculated by subtracting the 26-day EMA from the 12-day EMA.
A red line, which represents a 9-day EMA of the black line’s value and serves as the signal line.
When the black line rises above the red line, it indicates that the Nifty 50 is in an uptrend.
Conversely, when the black line falls below the red line, it suggests a downtrend.
3. Stochastic (14, 3, 3)
The Stochastic Oscillator is calculated using the 14-day high and 14-day low prices.
The number 3 represents the smoothing period, which is applied twice:
The first smoothing gives the black line, known as the Fast Stochastic.
A second 3-day smoothing creates the red line, called the Slow Stochastic.
Interpretation of the values:
Readings above 80 indicate an overbought condition.
Readings below 20 indicate an oversold condition.
The 50 level represents a neutral zone, where the market is neither overbought nor oversold.
These components together form a complete technical picture of the Nifty 50 index, helping traders identify potential entry and exit points with greater confidence.
Interpretation of the Chart
Highs and Lows
The Nifty 50 index has been forming higher highs and higher lows consecutively over the past three trading sessions.
This consistent pattern is a clear indication of a strong uptrend and reflects growing market confidence.
Resistance Break
Over the last 15 days, the Nifty 50 has broken through three major resistance levels — 25,000 (a strong psychological barrier), 25,449, and 25,676.
Successfully crossing these resistance zones further reinforces the bullish momentum and indicates strong buying pressure in the market.
Trend Line Break
The index has also broken a key trendline that was drawn from its all-time high of 26,277.35.
This breakout is an important technical event that suggests the market could be entering a new upward phase.
The full view of this trendline can be observed more clearly in the weekly chart shown below.
Price Far Above Moving Averages
The current price of the Nifty 50 stands at 25,709.85.
In comparison:
The 20-day EMA is around 25,172
The 50-day EMA is near 25,000
The 200-day EMA is around 24,500
This wide gap between the moving averages and the current price indicates extreme bullishness.
However, such a steep rise also suggests that a short-term correction or consolidation may occur before the next leg of the rally.
RSI (14) Approaching Overbought Territory
The Relative Strength Index (RSI 14) currently stands at 69.34, which is very close to the overbought level of 70.
This suggests that while the momentum remains strong, a short-term pullback cannot be ruled out as the market may need to cool off temporarily.
MACD Signal Buy
The MACD, which reflects the intermediate-term trend, shows a strong positive setup.
The MACD value is 144.74,
The signal line stands at 78.42.
Both lines are displaying positive divergence, indicating that the intermediate trend is aligned with the ongoing short-term uptrend.
This confirms that the market’s bullish momentum is not only intact but also strengthening.
Stochastic (14, 3, 3) Overbought:
Both the Fast Stochastic and Slow Stochastic indicators are currently in the overbought zone, with readings around 89.6.
This level signals that the short-term rally may be losing steam, and a pullback or minor correction could occur soon.
A price retracement in the coming week is therefore highly possible.
Insights
The short-term trend remains decisively upward, but traders should be cautious of a possible pullback towards 25,676 or 25,449 in the next week.
With Stochastics in overbought territory, volatility is expected to rise.
The upcoming week will be crucial to maintain the current bullish momentum.
Traders are strongly advised to use strict stop-loss levels to protect profits and manage risk effectively in this highly dynamic phase.
Trend Direction of Intermediate Trend
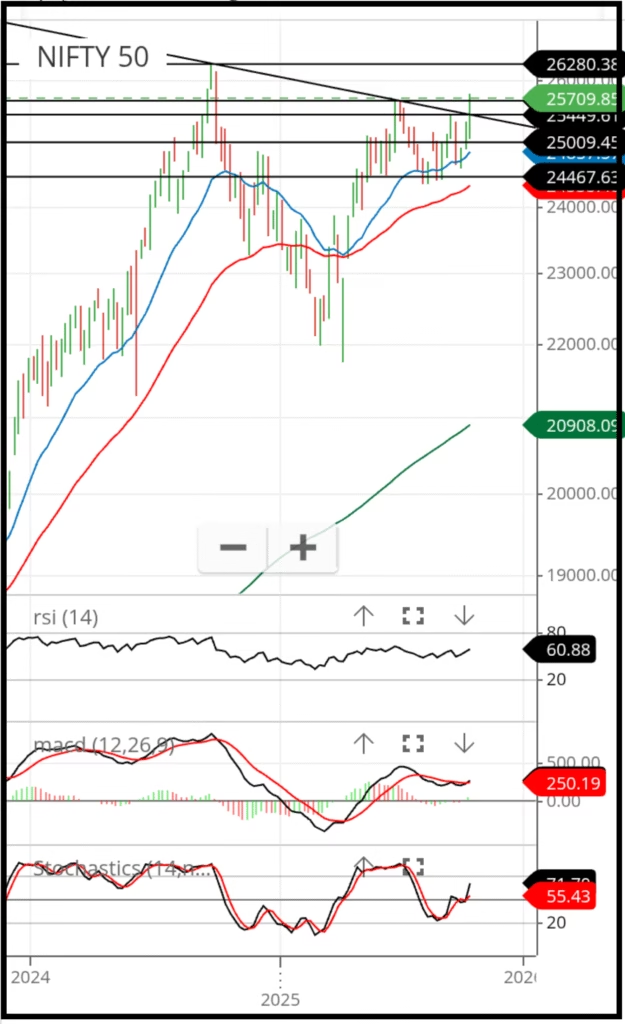
Chart Source: Zerodha Kite
Chart Description:
This chart follows the same structure as the daily chart, with one key difference — it represents weekly data instead of daily. Here, the weekly open, high, low, and close values are plotted to capture broader market movements. To display the complete trendline, a slightly more compact view has been used compared to the daily chart.
Chart Inference:
Higher Highs and Higher Lows
For the last two consecutive weeks, the chart has been forming higher highs and higher lows, clearly indicating that the weekly trend remains bullish.
Resistance Break
In just two weeks, the index has successfully broken three key resistance levels, out of which two were major resistances:
- 25,000 – A strong psychological resistance level.
- 25,676 – The second major resistance after the all-time high and also the 52-week high.
However, an important technical observation must be noted — when prices cross major resistance or support levels, they often retest them.
This suggests the possibility of a short-term correction, making this a good phase to apply the “buy on dips” strategy effectively.
Moving Averages
The 20-week and 50-week moving averages are now positioned close to the current price, indicating the beginning of a fresh bull run.
Furthermore, the 200-week moving average remains below the 50-week average, reinforcing the long-term bullish bias.
RSI and Stochastics
Both indicators are currently in neutral zones, yet the Slow Stochastic has recently crossed above the 50-level from below — a strong sign that the bear phase is ending.
When combining daily and weekly observations, it becomes evident that while a short intra-week correction may occur, weekly indicators still support a sustained upward trend.
MACD
MACD in intermediate Chart predicts long term trend.
The MACD on the intermediate-term chart shows the main (black) MACD line crossing above the signal (red) line, confirming a shift from a long-term downtrend to a long-term uptrend — a significant bullish development.
Insights:
The daily chart is approaching the overbought zone, whereas the weekly chart remains neutral.
Both short-term and intermediate-term trends point upwards.
This setup implies the likelihood of a quick pullback, followed by a swift recovery.
Traders are advised to buy on dips and avoid short positions at this stage.
Long Term Trend – Remains Bullish
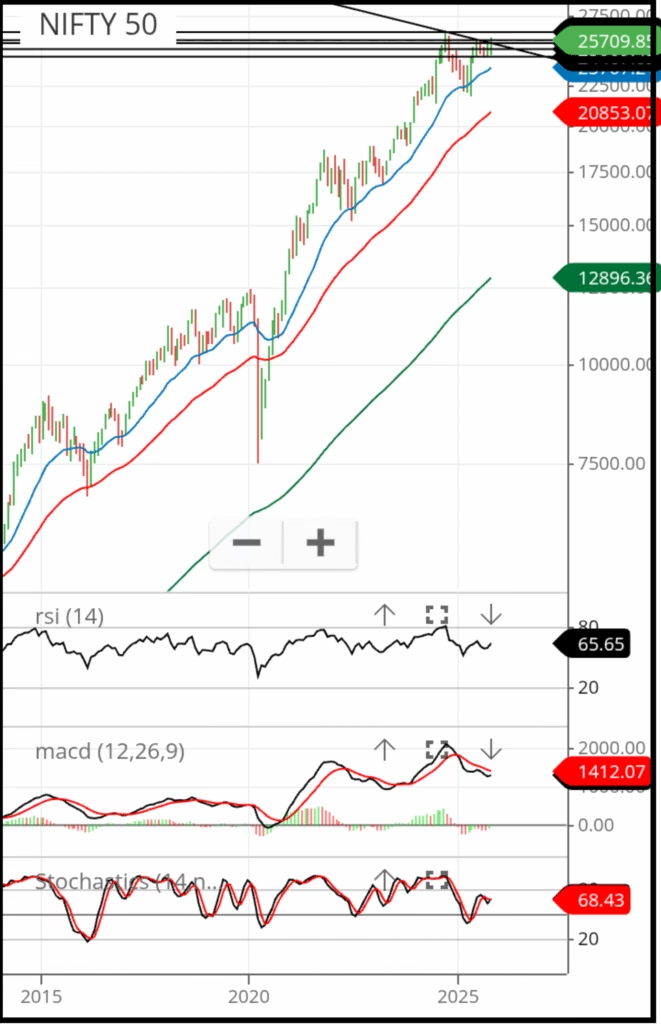
Chart Source: Zerodha Kite
Chart Description
This chart follows the same structure as the daily chart, with one key difference — it represents Monthly data instead of daily. Here, the Monthly open, high, low, and close values are plotted to capture broader market movements. To display the chart from 2014, a slightly more compact view has been used compared to the daily chart.
Inference from the Monthly Chart
In major economies like India, the USA, and Great Britain, the long-term market trend has historically remained upward.
Observing the Nifty 50 journey since 2005, we see only two notable declines — during the 2008–2009 Global Financial Crisis and the 2020 COVID-19 pandemic. In both cases, the trend reversed within a year (or even six months in 2020), confirming the strong long-term bullish structure of the market.
The chart above displays monthly candlesticks from 2014 to the present. Prices consistently touch the 20- or 50-month moving average and then rebound upward. Only in March 2020 did the price fall below the 50-month average — and even then, it sharply recovered soon after.
Using technical indicators on monthly charts is generally not advisable, as they often produce false signals. A single misleading signal could waste months of analysis. Instead, it’s wiser to assume the long-term trend remains upward and stay invested through major economic disruptions, as recovery usually occurs within two years.
Conclusion:
The long-term trend of Nifty 50 is strongly bullish. While short-term corrections may occur, they are typically followed by swift recoveries. Investors should stay long-term bullish, and traders are advised to avoid short positions during such phases.
Disclaimer:
This analysis is for educational and informational purposes only. It is not investment advice, and readers should conduct their own research or consult a financial advisor before making any trading decisions.