

Introduction :
During the past week, the Nifty 50 index witnessed some volatility, opening at 25,696.85 and closing slightly lower at 25,492.30, marking a decline of 0.89%. Despite testing a weekly high of 25,803.10, the index faced resistance near the 26,000 psychological mark before retreating to a low of 25,318.45. This short-term correction reflects a cooling-off phase after a strong upward move, even as the broader market structure remains supportive in the medium to long term.
Topics of Discussion
Table 1 : Weekly Performance
| Particulars | Value |
|---|---|
| Open | 25696.85 |
| High | 25803.10 |
| Low | 25318.45 |
| Close | 25492.3 |
| Previous Close | 25722.10 |
| Gain | -229.8 |
| Gain % | -0.89 |
Table 2 : Snapshot of Market Trends
| Time frame | Chart used | Trend Direction |
|---|---|---|
| Short Term | Daily | Down |
| Intermediate Term | Weekly | Up |
| Long Term | Monthly | Up |
Technical Analysis
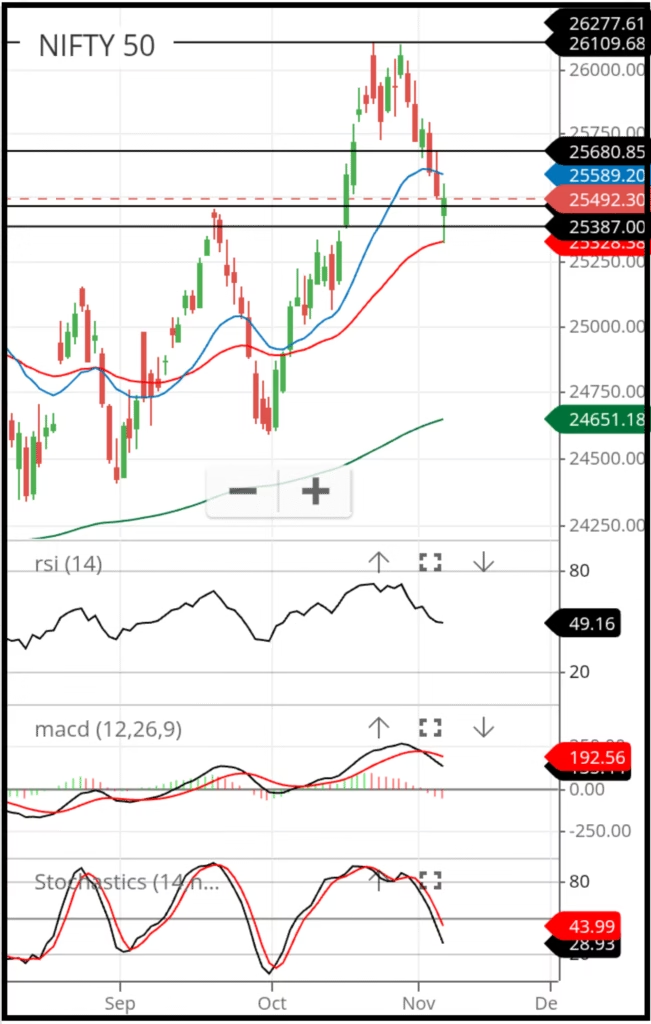
Chart Source Zerodha Kite
Chart Description
Candlestick Chart
This is a daily candlestick chart of the Nifty 50 index.
Green Candles
Green candles show that the closing price is higher than the opening price.
Red Candles
Red candles indicate that the closing price is lower than the opening price.
Wicks
- The upper wick represents the highest price reached during the day.
- The lower wick represents the lowest price of the day.
Signals from the Candlestick Chart
A green candlestick signals a bullish move, while a red candlestick signals a bearish move. Candlestick analysis is a broad subject, but the basic idea is simple:
- More than two consecutive green candles suggest a bullish bias.
- More than two consecutive red candles suggest a bearish bias.
Exponential Moving Averages (EMA)
- The blue line represents the 20-day EMA.
- The red line represents the 50-day EMA.
- The green line represents the 200-day EMA.
EMA Signals
- When the price stays above the EMA, it indicates a bullish trend.
- When the price stays below the EMA, it signals a bearish trend.
- When a short-term EMA crosses above a long-term EMA, it implies a bullish trend.
- When a long-term EMA stays above a short-term EMA, it implies a bearish trend.
Support and Resistance
The black horizontal lines on the chart mark support and resistance zones.
How to Read Support and Resistance
- When the price trades above a horizontal line, that line acts as support.
- When the price trades below a horizontal line, it becomes resistance.
There is also a form of psychological support and resistance, which appears at round numbers ending in zero (for example: 500, 1000, 6000, 25000, etc.). These levels exist even if they are not shown visually on the chart.
- When the price breaks above a resistance level, it is considered a bullish signal.
- When the price drops below a support level, it is viewed as a bearish signal.
Trendlines
The black sloping straight lines on the chart represent trendlines.
Trendlines are drawn by connecting major highs or major lows.
- A major low is a point where price stayed at the lowest level for a significant period (such as 1 month, 3 months, 6 months, 1 year, or even 3–5 years).
- A major high is the opposite — the highest price for a long duration (same time ranges as above).
Interpreting Trendlines
- When the price moves above a trendline, the market shows a bullish signal.
- When the price falls below a trendline, it indicates a bearish signal.
Relative Strength Index (RSI-14)
The RSI uses three key levels:
- Level 50: Above 50 → bulls are in control, Below 50 → bears are in control.
- Below 30: Bears dominate, but price enters the oversold zone, increasing the chance of a short-term pullback.
- Above 70: Bears still dominate, but price enters the overbought zone, suggesting a possible short-term pullback.
Stochastics (9, 3, 3)
The Stochastic indicator contains two lines — one black and one red. The red line is not a signal line; it represents the slow stochastic, while the black line represents the fast stochastic.
Like RSI, this tool also works around three reference levels:
- Level 50: Above 50 → bulls are in control, Below 50 → bears are in control.
- Below 20: Bears dominate, but the price has entered the oversold region, meaning a short-term bounce is possible.
- Above 80: Bears dominate again, but price has reached the overbought region, suggesting a pullback may follow.
MACD (12, 26, 9)
The MACD contains two lines — black and red. The red line is the signal line, and the histogram is formed from the difference between the two lines.
MACD is a powerful indicator but tends to react late. It reflects intermediate-term trends on a short-term chart.
The zero line plays a crucial role:
- When MACD moves above the zero line, it signals that bears are losing strength and bulls are beginning to take control.
- When MACD drops below zero, the opposite scenario occurs.
- When the black line crosses above the red line, it suggests a strong bullish intermediate trend.
- When the black line crosses below the red line, it signals a strong bearish intermediate trend.
- More than two consecutive green histogram bars show growing bullish momentum.
- More than two consecutive red histogram bars show increasing bearish momentum.
Chart Inference:
The Nifty 50 recently broke above the key resistance level of 25,686, and further crossed the 26,000 mark, a major psychological barrier for investors. However, the index has since experienced a pullback to 25,318. While the intermediate-term trend (as seen on the weekly chart) remains intact and bullish, some short-term weakness is evident on the daily chart.
Chart Pattern
The chart pattern continues to display two consecutive higher highs and two consecutive higher lows, reaffirming the underlying bullish structure. Nevertheless, the index has been on a downward movement for the last seven trading sessions, indicating short-term corrective pressure within an overall uptrend.
Support & Resistance Commentary
The Nifty 50 is currently positioned near multiple resistance levels, marked at 25,686, 26000, 26104 and 26,277
In the near term, the immediate resistance lies at 25,686. If the index successfully breaches 25,686 on a closing basis, we may expect a further upward move toward the next resistance zone at 26,000.
Should the momentum continue and the index manage to sustain above 26,000, the next potential upside target becomes 26,277.
On the downside, the index has three key support levels placed at 25318, 25000, and 24588.
If Nifty slips below the support at 25318, the next likely downside test would be the zone around 25000.
A further breakdown below 25000 may drag the index toward the deeper support at 24588, which is expected to act as a stronger cushion unless a major trend reversal takes place.
Table 3 : Supports And Resistances
| Support 1 | 24,588 |
| Support 2 | 25,000 |
| Support 3 | 25,318 |
| Closing | 25,492 |
| Resistance 1 | 25686 |
| Resistance 2 | 26000 |
| Resistance 3 | 26,104 And 26,277 |
Interpretation of EMAs (20, 50, 200)
The price is currently below the 20 EMA, indicating a short-term bearish trend.
The price is currently above the 50 EMA, indicating an intermediate-term bullish trend.
The price is currently above the 200 EMA, indicating a long-term bullish trend.
Additionally, the 20 EMA is above the 50 EMA, which confirms a bullish intermediate trend.
The 50 EMA is above the 200 EMA, which confirms a bullish long-term trend.
Table 4 : Exponential Moving Averages (EMAs)
| EMA | Value | Comments | Inference |
|---|---|---|---|
| EMA – 10 | 25,657 | Above Price | Sell |
| EMA – 20 | 25,589 | Above Price | Sell |
| EMA – 50 | 25,326 | Below Price | Buy |
| EMA – 200 | 24,644 | Below Price | Buy |
Interpretation of RSI (14)
The current RSI (14) value is 49.16 Since the RSI is near to the 50-level threshold, market momentum currently neutral.
Traders should exercise caution and avoid initiating aggressive short positions at this stage. Instead, the preferred strategy is to buy on dips as intermediate trend is up
Interpretation of Stochastics
The current Stochastics value is 29. Since the Stochastics is below the 50-level threshold, market momentum currently favors the bears.
The indicator is approaching the oversold zone, which suggests a potential short-term rebound. Traders should exercise caution and avoid initiating aggressive short positions at this stage. Instead, the preferred strategy is to buy on dips until the indicator confirms a clearer trend reversal.
Interpretation of MACD
The MACD value is currently 135, which is above the zero line. This indicates that the market is presently under the control of the bulls.
But the MACD line (black) is below the signal line (red), which further confirms a bearish momentum shift. As long as this crossover remains intact, the prevailing trend is expected to weaken.
However, if the MACD line begins to converge toward the signal line, traders should be alert for a possible reversal of short term trend . A confirmed crossover in the opposite direction would signal a buying opportunity.
Table 5 : Indicators
| Indicator | Value | Comments | Inference |
|---|---|---|---|
| RSI | 49.16 | Flattering | Neutral |
| Stochastics | Fast 28.93 Slow 43.99 | In Bearish territory | Sell |
| MACD | 135 & Signal line 192.56 | Downward Slope | Sell |
Technical Outlook:
Overall technical bias and expected price action
Table 6 : Overall Technical Summary
| Object | Comments | Final Verdict |
|---|---|---|
| Trendline | Downward Slope | Sell |
| EMAs | Not Clear | Buy on dips |
| RSI | Neutral | Neutral |
| Stochastics | Below 50 | Sell |
| MACD | Negative | Sell |
| Overall Outlook | Intermediate trend -Up Short Term trend – Down | Buy on Dips ( Great Opportunity) |
Key Technical Insights
Overall, while the daily chart signals a short-term downtrend, the weekly and monthly trends remain firmly bullish. The pattern of higher highs and higher lows continues to suggest underlying strength in the market. Given this setup, investors may consider adopting a “buy-on-dips” strategy or begin accumulating fundamentally strong value stocks, taking advantage of the current pullback within a larger uptrend.
Other Analyst Recommendations and Market Cues:
Buying opportunities on dips: Some analysts see potential buying opportunities on dips, particularly in quality financial and metal stocks, while using tight stop-losses.
Bearish-to-range-bound: Several analysts and market reports point to a cautious or negative short-term trend.
Support and Resistance: Immediate support levels are at 25,400 and 25,300, with key resistance at 25,600-25,800. A decisive breakout above 25,800 is needed to negate the bearish setup.
FII selling: Persistent selling by Foreign Institutional Investors (FIIs) is noted as a factor in the market’s cautious sentiment.
Consolidation phase: The market is generally in a consolidation phase, with profit-booking taking place rather than a panic-driven sell-off.
Mixed global cues: Mixed global signals also contribute to the cautious outlook.
“Sell-on-rise” strategy: Some experts advise a “sell-on-rise” approach, though others suggest waiting for specific breakout levels before making moves.
Factors Affecting Nifty50 Performance
Key factors affecting Nifty 50 performance include both macroeconomic and domestic variables, such as government and monetary policies, interest rates, inflation, foreign and domestic investment trends, economic indicators like crude oil prices, and corporate earnings. Geopolitical events and natural disasters can also cause volatility.
Macroeconomic factors:
- Inflation: High inflation can negatively impact the Nifty 50 by increasing input costs for businesses, reducing purchasing power, and harming investor confidence.
- Interest Rates: When the Reserve Bank of India (RBI) raises key rates (like the repo rate), it reduces liquidity in the market and makes borrowing more expensive for companies and individuals. This can slow business expansion and lead to a fall in stock prices.
- Exchange Rates: The fluctuation of the Indian Rupee against other currencies, such as the US dollar, affects companies, especially those involved in exports and imports. A stronger rupee can make exports more expensive and decrease revenue for export-oriented firms, potentially impacting their stock prices.
- Crude Oil Prices: Since India is a net importer of crude oil, rising oil prices can increase expenses for many businesses and negatively affect the economy, influencing the stock market.
- GDP: The Gross Domestic Product (GDP) is an indicator of the overall economic health of the country. A healthy GDP can positively affect the financial markets and investment.
Domestic and market-specific factors
- Government Policies: Fiscal policies and other new government regulations can either benefit or harm the economy and specific industries, thereby affecting the stock market. For example, a change in corporate taxes could impact company profits and stock prices.
- Foreign and Domestic Investment: The activity of Foreign Institutional Investors (FIIs) and Domestic Institutional Investors (DIIs) plays a significant role in influencing the market. A large outflow of capital from FIIs can cause the market to drop, while their entry can boost it.
- Corporate Earnings: The performance of the companies within the Nifty 50 index is a key driver. Strong corporate earnings reports can drive the index higher, while weak performance can cause a decline.
- Sector-Specific Performance: The index is composed of companies from various sectors. The performance of key sectors like banking, IT, and consumer goods can significantly influence the overall index movement.
- Political Stability and Events: Factors like elections, budget announcements, and government stability can create market volatility.
Other influencing factors
Natural Disasters: Such events can negatively impact companies’ performance and the overall economy, leading to lower sales and revenue, ultimately affecting stock prices.
Global Market Trends: The Nifty 50 is also impacted by international trends, such as economic conditions in major economies and global monetary policies.
Gold Prices: Gold is often considered a safe-haven asset. During economic crises or periods of high inflation, some investors may move their money from stocks to gold, which can negatively affect stock market performance.
Conclusion:
The performance of the Nifty 50 is shaped by a combination of macroeconomic, domestic, and global factors, each influencing investor sentiment and market direction in different ways. While inflation, interest rates, and crude oil prices affect the broader economy, corporate earnings, government policies, and sector performance directly determine the index’s momentum. Additionally, foreign investments, political stability, and global market trends can amplify volatility or strengthen long-term growth prospects. In essence, understanding these interconnected factors helps investors make informed decisions, manage risks effectively, and align their strategies with the evolving market environment.
Read More


Weekly Close: 25,492.3
(Change: -229.8 points(-0.89%)