
Introduction
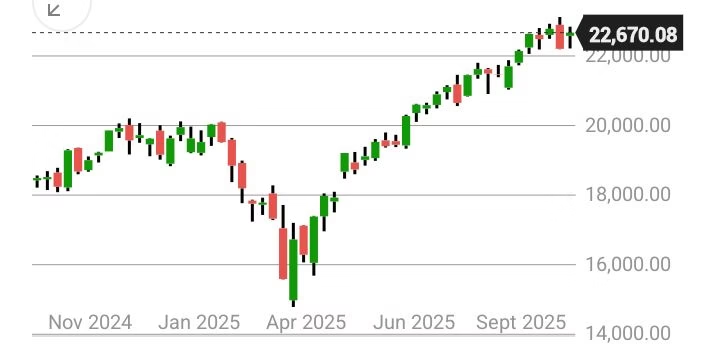
On October 15, 2025, the NASDAQ Composite closed at 22,670.1271, rising 0.66%. The Nasdaq Composite recovered on Monday, October 13, 2025, after a sharp fall on Friday, October 10, primarily because former President Donald Trump adopted a softer tone on US-China trade relations. The market’s rebound was also fueled by strong performance in artificial intelligence (AI) stocks.
Topics of Discussion
Key factors behind the recovery
- De-escalation of US-China trade tensions: The main reason for the market plunge on October 10 was Trump’s threat of 100% tariffs on Chinese goods in retaliation for China’s curbs on rare-earth exports. Over the weekend, however, Trump softened his rhetoric, and his allies downplayed the tariff threat. This eased investor worries, leading to a recovery across the market.
- Strong performance by AI and tech stocks: The Nasdaq, a tech-heavy index, saw strong gains from AI-related companies, which were among the hardest hit by the earlier sell-off.
- Broadcom announced a new partnership with OpenAI to produce AI processors, causing its shares to surge by almost 10%.
- Other AI-related chipmakers, like Nvidia and Micron Technology, also gained, boosting the overall tech sector.
- Investor resilience: Following the market fluctuations, some analysts noted that investors were taking advantage of the dips to buy at lower prices, showing a long-term confidence in US stocks despite volatility.
- Weakening US labor market and rate-cut bets: In the weeks leading up to the market turbulence, recent economic data showed signs of weakness in the US labor market. This increased certainty among some investors that the Federal Reserve would proceed with interest rate cuts, which can stimulate the market.
Summary of the event
- Friday, October 10: The Nasdaq and other major indexes experienced their steepest weekly declines in months after Trump announced a tariff threat against China. The Nasdaq was down nearly 4% from its daily peak.
- Weekend: Trump walked back his aggressive stance on China trade relations via social media, telling investors, “Don’t worry about China, it will all be fine!”.
- Monday, October 13: Investors reacted positively to the de-escalation of trade tensions. Gains in AI-related tech stocks helped propel the Nasdaq and other indices to a sharp recovery.
Nasdaq Composite : Quick Review
| Particulars | Value |
| Open | 22,738.50 |
| High | 22841.69 |
| Low | 22427.79 |
| Close | 22670. |
| Previous Close | 22521.70 |
| Change | 0.66% |
| 52 Week High | 23119.91 |
| 52 Week Low | 14787.03 |
Quick view – Factors Governing NASDAQ Composite Performance:
Key factors influencing its performance include market sentiment, expectations regarding interest rates, corporate earnings, geopolitical events, and the significant weight of the technology sector.
- Technology sector influence: The Nasdaq Composite is heavily weighted toward technology stocks, with the top 10 stocks accounting for a significant portion of its performance. Market optimism and developments in artificial intelligence fueled a rally in major tech stocks yesterday, including Nvidia, Microsoft, and Apple.
- Interest rates: Lower interest rates and borrowing costs typically support stock market returns, particularly for growth stocks like those in the tech sector. Strong indications of a potential Federal Reserve rate cut in December contributed to the market’s rally yesterday.
- Corporate earnings: Strong earnings from companies, especially major tech and bank stocks, positively impact the market by signaling a healthy economy and bolstering investor confidence.
- Geopolitical events: Events such as trade disputes can create uncertainty and impact market valuations, particularly for companies relying on global supply chains. However, easing trade tensions, such as reports of renewed trade talks, can add fuel to a market rally.
- Economic indicators: Overall economic indicators, such as consumer activity and investment banking revenue, influence market behavior. Yesterday’s rally was partly fueled by robust bank earnings, signaling a sturdy economy and healthy consumer activity.
Also Read


Technical Analysis of Nasdaq Composite:
Here is a technical overview of the Nasdaq Composite based on data up to October 15, 2025. Please note that technical analysis focuses on past price movements to predict future trends.
Resistances and Supports Table
| Close | 22670.88(+0.66%) |
| Resistances | Levels |
| 1 | 22818 |
| 2 | 23000 be |
| 3 | 23448 |
| Supports | Levels |
| 1 | 22509 |
| 2 | 21990 |
| 3 | 21500 |
Moving Average Table
| Period (Days) | Simple | Exponential |
| 5 | 22623 | 22643 |
| 10 | 22751 | 22672 |
| 20 | 22667 | 22553 |
| 50 | 22053 | 22043 |
| 100 | 21113 | 21260 |
| 200 | 19766 | 20167 |
Oscillator Table
| Indicator | Vaue | Inference |
| RSI(14) | 54.30 | Neutral |
| Stoch (9,6) | 96.47 | Overbought |
| MACD (12,26) | 188.38 | Buy |
| ADX | 26.012 | Neutral |
Insights
- Current Price: 22670.08
- Key Resistance: Strong resistance levels are noted at 22,818 and 23,000 Overcoming 23,818 and subsequently 23,000 is necessary to alleviate downside pressure and to achieve potentially target the 23,448 level.
- Key Support: Failure to breach the resistance levels could lead to a decline towards 22,509. A break below 22,509 would increase selling pressure, potentially pushing the index down to 21,990.
- Recent Performance: The Nasdaq Composite surged 2.21% on October 13 but then fell nearly 2% on October 14. On October 15 recovered partially by 0.66%
- Technical Indicators: The current trend is strongly bullish, supported by moving averages, but caution is advised as Stochastics lies in overbought territory, potentially signaling a short-term correction.
Also Read


Key Factors Influencing the Performance of US Stock Market
The performance of the US stock market is shaped by a combination of macroeconomic conditions, monetary policy decisions, political and geopolitical developments, and overall investor sentiment. These factors collectively impact investor confidence, corporate earnings, and ultimately, stock valuations.
Macroeconomic Factors
Gross Domestic Product (GDP):
GDP represents the total market value of goods and services produced within the economy. A strong GDP reflects robust economic growth and tends to support higher stock prices, while a slowdown or contraction often signals an economic downturn, leading to market weakness.
Inflation:
Elevated inflation erodes purchasing power, raises input costs for businesses, and often prompts the Federal Reserve to tighten monetary policy by increasing interest rates—factors that typically weigh on equity markets.
Unemployment Rate:
Low unemployment indicates a strong labor market and healthy consumer spending, both of which support corporate profitability and stock market gains.
Industrial Production:
The Industrial Production Index (IPI), published by the Federal Reserve, measures output in manufacturing, mining, and utilities. An uptick in production usually reflects economic strength, while declines may point to contraction.
Retail Sales:
Retail sales data offer a direct insight into consumer demand, a major driver of the US economy. Rising sales generally signal economic expansion and bolster investor confidence.
Exchange Rates:
The strength of the US dollar has a significant impact on multinational corporations. A stronger dollar can reduce the competitiveness of US exports and weigh on overseas revenues, while a weaker dollar tends to benefit exporters.
Monetary Policy
Interest Rates:
The Federal Reserve’s control of short-term interest rates is one of the most influential market drivers. Higher rates increase borrowing costs and make fixed-income assets more attractive relative to equities, often pressuring stock prices. Conversely, lower rates encourage borrowing and investment, typically lifting market sentiment.
Federal Reserve Actions:
Beyond rate changes, the Fed’s broader monetary tools—such as quantitative easing (QE) or tightening (QT)—and its forward guidance can significantly affect market liquidity, volatility, and investor expectations.
Political and Geopolitical Events
Government Policies and Stability:
Fiscal policies, taxation, regulatory decisions, and overall political stability play a critical role in shaping business conditions and investor confidence. Political uncertainty often leads to heightened volatility.
Trade Relations and Tariffs:
Trade disputes or tariff impositions—particularly between major economies such as the US and China—can disrupt supply chains, increase production costs, and inject uncertainty into global markets.
Global Events and Conflicts:
Crises such as wars, pandemics, and natural disasters can alter consumer behavior, disrupt trade flows, and create global risk aversion, all of which may negatively affect US equities.
Investor Sentiment
Fear and Greed Dynamics:
Investor psychology often drives short-term market movements. Excessive optimism can inflate asset bubbles, while widespread fear may trigger sharp sell-offs.
Corporate Earnings Reports:
Earnings announcements are a key determinant of market direction. Positive surprises can lift investor confidence and fuel rallies, while disappointing results can prompt broad-based declines.
Speculation and Market Trends:
Shifts in investor focus—such as enthusiasm around emerging technologies or sector-specific booms—can lead to rapid price movements and potential overvaluation risks.
Conclusion :
The Nasdaq’s recovery on October 15, 2025, highlights renewed market confidence fueled by easing geopolitical tensions and robust performance in AI and tech-driven sectors. The momentum remains decisively bullish, with buyers reclaiming control after last week’s dip.
However, traders should remain cautious, as Stochastic indicators are deep in the overbought territory, hinting at a possible short-term pause or mild correction before the next leg higher. Sustained buying above key resistance levels could confirm a continuation of the uptrend, reinforcing the market’s strong bullish sentiment heading into the next week.
Frequently Asked Questions (FAQ)
1. What caused the Nasdaq Composite to rise on October 15, 2025?
Nasdaq gained due to renewed optimism after former President Donald Trump’s softer tone on US-China trade relations, along with strong momentum in AI-related stocks.
2. What is the current resistance level for the Nasdaq Composite?
The key resistance zone lies near the 22,800–23,000 range. A breakout above this level could confirm sustained bullish momentum.
3. How do geopolitical factors affect the Nasdaq?
Trade tensions, elections, and global conflicts directly influence investor sentiment and tech valuations, which are major drivers of the Nasdaq index.
4. Which sectors are currently leading the Nasdaq rally?
Technology, particularly artificial intelligence, semiconductor, and cloud-based companies, continue to drive most of the upside momentum.
5. Is the Nasdaq trend still bullish?
Yes, the short-term trend remains bullish as long as the index holds above key support near 22,500. However, overbought signals suggest caution.
6. Should investors enter the market now?
While momentum remains strong, the Stochastics indicator shows overbought conditions. Investors should wait for a minor pullback or consolidation before adding new positions.
Disclaimer:
This article is for informational and educational purposes only. It should not be considered as investment, trading, or financial advice. Market conditions can change rapidly due to global and economic developments. Always conduct your own research or consult a qualified financial advisor before making investment decisions.