

Introduction
Table 1 : Weekly Performance of Nasdaq Composite
Introduction
After displaying consistent resilience over the past three weeks, the Nasdaq witnessed a notable decline of 720.42 points, or 3.04%, last week. The index opened at 23,951.91 on Monday and closed the week at 23,004.54 on Friday, after touching a low of 22,563.42 during the session.
Despite the sharp correction, the medium-, and long-term trends continue to remain bullish, suggesting that the broader market structure is still intact. However, the recent pullback signals that a limited downside or range-bound movement may dominate in the upcoming week.
As the market enters the week of 10th to 14th November 2025, the technical outlook indicates sustained underlying strength, though selective consolidation at higher levels cannot be ruled out. In the following analysis, we will review the technical summary, key chart patterns, and potential stock opportunities within the Nasdaq index—highlighting areas where investors can buy on dips or accumulate quality technology names for medium-term gains.
Topics of Discussion
| Particulars | Value |
|---|---|
| Open | 23951.91 |
| High | 23976.84 |
| Low | 22563.42 |
| Close | 23004.54 |
| Previous Close | 23724.96 |
| Gain | -720.42 |
| Gain % | -3.04 |
Table 2 : Snapshot of Nasdaq Trends
| Time frame | Chart used | Trend Direction |
|---|---|---|
| Short Term | Daily | Down |
| Intermediate Term | Weekly | Neutral |
| Long Term | Monthly | Up |
Technical Analysis of Nasdaq Composite
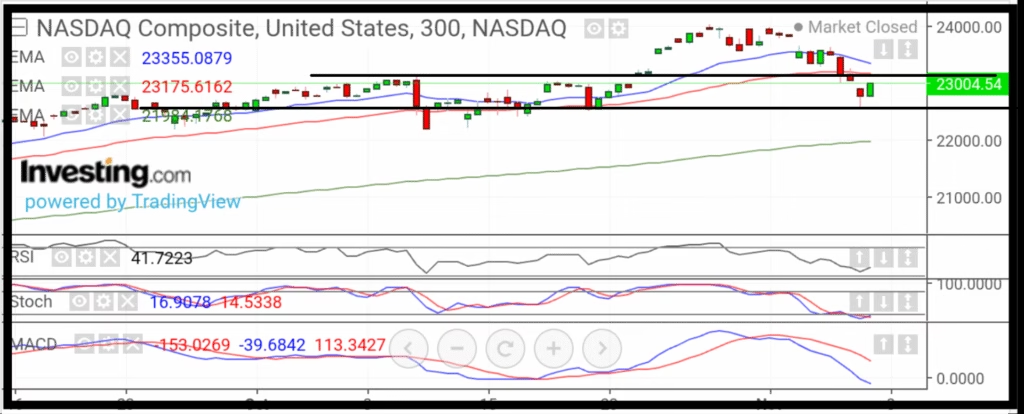
Chart Source Investing.com
Chart Description
Candlestick Chart
This is a daily candlestick chart of the Nifty 50 index.
Green Candles
Green candles show that the closing price is higher than the opening price.
Red Candles
Red candles indicate that the closing price is lower than the opening price.
Wicks
- The upper wick represents the highest price reached during the day.
- The lower wick represents the lowest price of the day.
Signals from the Candlestick Chart
A green candlestick signals a bullish move, while a red candlestick signals a bearish move. Candlestick analysis is a broad subject, but the basic idea is simple:
- More than two consecutive green candles suggest a bullish bias.
- More than two consecutive red candles suggest a bearish bias.
Exponential Moving Averages (EMA)
- The blue line represents the 20-day EMA.
- The red line represents the 50-day EMA.
- The green line represents the 200-day EMA.
EMA Signals
- When the price stays above the EMA, it indicates a bullish trend.
- When the price stays below the EMA, it signals a bearish trend.
- When a short-term EMA crosses above a long-term EMA, it implies a bullish trend.
- When a long-term EMA stays above a short-term EMA, it implies a bearish trend.
Support and Resistance
How to Read Support and Resistance
- When the price trades above a horizontal line, that line acts as support.
- When the price trades below a horizontal line, it becomes resistance.
There is also a form of psychological support and resistance, which appears at round numbers ending in zero (for example: 500, 1000, 6000, 25000, etc.). These levels exist even if they are not shown visually on the chart.
- When the price breaks above a resistance level, it is considered a bullish signal.
- When the price drops below a support level, it is viewed as a bearish signal.
Relative Strength Index (RSI-14)
The RSI uses three key levels:
- Level 50: Above 50 → bulls are in control, Below 50 → bears are in control.
- Below 30: Bears dominate, but price enters the oversold zone, increasing the chance of a short-term pullback.
- Above 70: Bears still dominate, but price enters the overbought zone, suggesting a possible short-term pullback.
Stochastics
The Stochastic indicator contains two lines — one black and one red. The red line is not a signal line; it represents the slow stochastic, while the black line represents the fast stochastic.
Like RSI, this tool also works around three reference levels:
- Level 50: Above 50 → bulls are in control, Below 50 → bears are in control.
- Below 20: Bears dominate, but the price has entered the oversold region, meaning a short-term bounce is possible.
- Above 80: Bears dominate again, but price has reached the overbought region, suggesting a pullback may follow.
MACD (12, 26, 9)
The MACD contains two lines — black and red. The red line is the signal line, and the histogram is formed from the difference between the two lines.
MACD is a powerful indicator but tends to react late. It reflects intermediate-term trends on a short-term chart.
The zero line plays a crucial role:
- When MACD moves above the zero line, it signals that bears are losing strength and bulls are beginning to take control.
- When MACD drops below zero, the opposite scenario occurs.
- When the black line crosses above the red line, it suggests a strong bullish intermediate trend.
- When the black line crosses below the red line, it signals a strong bearish intermediate trend.
- More than two consecutive green histogram bars show growing bullish momentum.
- More than two consecutive red histogram bars show increasing bearish momentum.
Candlestick Chart
This is a daily candlestick chart of the Nifty 50 index. Details and how to read the chart is shown in the article below
Chart Inference
Chart Pattern
The Nasdaq Composite has been forming a consistent pattern of higher highs and higher lows, reflecting a strong bullish structure. Since April, the index has been trading within an upward-sloping channel, where each corrective phase has been short-lived, followed by swift recoveries.
This structure resembles an uptrending flag pattern, a sign of sustained optimism with periodic profit-booking. However, if the index breaks below this established channel, it could trigger a meaningful correction. The recent decline observed last week might well be the beginning of a medium-term pullback — a healthy phase that could restore balance and strengthen the market’s long-term trajectory.
Support & Resistance Commentary
The Nasdaq is currently positioned near multiple resistance levels, marked at 23492, 23998, and 24272.
In the near term, the immediate resistance lies at 23492. If the index successfully breaches 23492 on a closing basis, we may expect a further upward move toward the next resistance zone at 23998.
Should the momentum continue and the index manage to sustain above 23998, the next potential upside target becomes 24272.
On the downside, the index has three key support levels placed at 23472, 23220, and 22946.
If the index slips below the support at 23472, the next likely downside test would be the zone around 23220.
A further breakdown below 23220 may drag the index toward the deeper support at 22946, which is expected to act as a stronger cushion unless a major trend reversal takes place.
Table 3 : Supports And Resistances of Bank Nifty
| Support 3 | 22946 |
| Support 2 | 23220 |
| Support 1 | 23472 |
| Closing | 23004.54 |
| Resistance 1 | 23492 |
| Resistance 2 | 23998 |
| Resistance 3 | 24272 |
Interpretation of EMAs (20, 50, 200)
The price is currently below the 20 EMA, indicating a short-term bearish trend.
The price is currently below the 50 EMA, indicating an intermediate-term bearish trend.
The price is currently above the 200 EMA, indicating a long-term bullish trend.
Additionally, the 20 EMA is above the 50 EMA, which confirms a bullish intermediate trend.
The 50 EMA is above the 200 EMA, which confirms a bullish long-term trend.
Table 4 : Exponential Moving Averages (EMAs)
| EMA | Value | Comments | Inference |
|---|---|---|---|
| EMA – 10 | 23307 | Above Closing | Sell |
| EMA – 20 | 23213 | Above Closing | Sell |
| EMA – 50 | 22677 | Above Closing | Sell |
| EMA – 200 | 20651 | Below Closing | Buy |
Interpretation of RSI (14)
The current RSI (14) value is 48.61. Since the RSI is below the 50-level threshold, market momentum currently favors the bears.
The indicator is in neutral zone, which suggests a potential range bound movement. Traders should exercise caution and avoid initiating aggressive short positions at this stage. Instead, the preferred strategy is to buy on dips until the indicator confirms a clearer trend.
Interpretation of Stochastics
The current Slow Stochastics (14) value is 57.14. Since the Stochastics is above the 50-level threshold, market momentum currently favors the bulls.
The indicator is in neutral zone, which suggests a potential range bound movement. Traders should exercise caution and avoid initiating aggressive short positions at this stage. Instead, the preferred strategy is to buy on dips until the indicator confirms a clearer trend.
Interpretation of MACD
The MACD value is currently 212.32, which is above the zero line. This indicates that the market is presently under the control of the bulls.
But, the MACD line (black) is below the signal line (red), which further confirms a bearish momentum shift. As long as this crossover remains intact, the prevailing down trend is expected to continue.
However, if the MACD line begins to converge toward the signal line, traders should be alert for a possible reversal. A confirmed crossover in the opposite direction would signal a fresh buying opportunity.
Table 5 : Indicators
| Indicator | Value | Comments | Inference |
|---|---|---|---|
| RSI | 48.61 | Moving Down | Sell |
| Stochastics | slow-57.11 Fast-45.45 | Downward slope | Sell |
| MACD | 212.32 | Recent Bearish Crossover | Sell |
Technical Outlook:
Table 6 : Overall Technical Summary
| Object | Comments | Final Verdict |
|---|---|---|
| Chart Pattern | Channel break out | Sell |
| EMAs | Bearish intermediate and Short term trend | Sell |
| RSI | Moving Down | Sell |
| Stochastics | Moving Dow | Sell |
| MACD | Bearish Crossover | Sell |
| Overall Outlook | intermediate Term correction | Buy in dip with strict stoploss |
Key Insights:
The chart pattern indicates a channel breakout, which signals potential weakness and a short-term selling opportunity.
Exponential Moving Averages (EMAs) confirm a bearish trend in both short and intermediate terms, strengthening the downside view.
RSI (Relative Strength Index) is moving downward, suggesting declining momentum and increasing selling pressure.
Stochastics are also moving down, reflecting that the market may continue to stay under selling dominance in the near term.
MACD shows a bearish crossover, further validating the ongoing negative sentiment.
Overall, the market appears to be entering an intermediate-term correction phase. Traders should avoid aggressive buying at current levels but can consider buying on dips with a strict stop-loss approach to manage risk effectively.
Factors Affecting the Performance of Nasdaq Composite
Factors affecting the Nasdaq Composite include its high concentration of technology stocks, macroeconomic conditions like interest rates and inflation, corporate performance and earnings, investor sentiment, and global events. The index is market-capitalization-weighted, which means that the largest companies, primarily in the technology sector, have the most significant influence on its movement.
Technology sector concentration
- High weighting: As of early 2025, approximately 60% of the index was composed of technology-related companies, with major tech firms like Apple, Microsoft, and Nvidia having the most significant impact.
- Performance of top companies: Strong or weak performance from these mega-cap tech stocks can have a disproportionate effect on the entire index.
Macroeconomic factors
- Interest rates: Policy decisions by the Federal Reserve, such as raising or lowering interest rates, can significantly influence the Nasdaq. Higher interest rates tend to put downward pressure on growth stocks, which are prevalent in the index.
- Inflation: High inflation can increase a company’s costs and reduce its future earnings, negatively impacting investor valuation multiples.
- GDP growth: Broader economic indicators, such as GDP growth, have a positive correlation with the Nasdaq Composite.
Corporate performance and earnings
- Company profits: The earnings and growth prospects of the companies within the index are fundamental drivers of their stock prices and, therefore, the overall index.
- Technology innovation: Periods of high innovation, such as the boom in artificial intelligence, can fuel rapid growth in the index, as seen in 2023 and 2024.
Investor sentiment
- Confidence: Investor confidence and overall market sentiment, which can be influenced by economic indicators or major news events, play a significant role in market fluctuations.
- Trader sentiment: News and trader attention can cause the underlying share prices to change, moving the index’s value.
Global events
- Geopolitical risks: Wars, conflicts, and trade policies can introduce uncertainty and affect investor confidence, leading to market volatility.
- Supply chain disruptions: Events that impact global supply chains, such as the COVID-19 pandemic or trade tariffs, can affect company performance and subsequently the index.
Read More


23,004.54
Change: -720.42 points (-3.04%)