
Introduction:
KEI Industries Limited is a leading Indian manufacturer specializing in a wide spectrum of electrical wires and cables, along with stainless steel wires. Headquartered in New Delhi, the company operates multiple manufacturing plants across India and serves both domestic and international markets.
Topics of Discussion
Products Manufactured by KEI Industries
KEI’s product portfolio caters to residential, commercial, industrial, and infrastructure applications. Major offerings include:
Power Cables: Extra-high voltage (EHV), high tension (HT), and low tension (LT) cables.
Flexible Wires: Single-core and multi-core copper wires used in homes, appliances, and motors.
Instrumentation Cables: Designed for process industries such as oil & gas, petrochemicals, and steel.
Winding Wires: Specialized insulated wires for submersible motors.
Rubber Cables: Heavy-duty cables suitable for mining, defense, and other demanding applications.
Specialty Cables: Including solar cables, communication cables, fire-resistant and fire-survival cables, as well as marine and offshore cables.
Stainless Steel Wires: Widely used in construction, engineering, and kitchenware.
EPC Services: Engineering, procurement, and construction solutions for power sector projects.
Locations – KEI Industries
Headquarters:
D-90, Okhla Industrial Area, Phase-1, New Delhi.
Manufacturing Units :
Bhiwadi, Rajasthan
Chopanki, Rajasthan
Silvassa, Dadra & Nagar Haveli
Upcoming plant at Sanand, Ahmedabad, Gujarat (land acquired in May 2023)
Global Presence
KEI Industries has a strong international footprint, exporting to over 60 countries worldwide. Domestically, the company is supported by an extensive network of branch offices and warehouses across India.
KEI Industries : SWOT Analysis
A concise, comprehensive investor-focused blog post covering KEI Industries’ strengths, weaknesses, opportunities, threats, financials, technical picture, investor sentiment and competitive positioning. Data and market notes include the company’s situation as of October 3, 2025.
SWOT Analysis — KEI Industries
Strengths
- Diversified product portfolio: EHV, HT, LT power cables, control cables, house wires and specialty cables — reduces single-segment dependency.
- Strong brand & distribution: Pan-India retail network plus institutional/export relationships.
- Leader in EHV cables: High-margin, specialized manufacturing capability.
- Robust financials: Healthy revenue & profit growth, strong returns (ROE/ROCE historically good), very low debt-to-equity.
- Growing export business: Presence in 60+ countries — provides geographic diversification and partial hedge versus import currency risk.
- Proven management efficiency: Example metric: ROE cited at ~18.1%.
Weaknesses
- Raw material import dependence: Heavy reliance on imported copper/aluminum exposes margins to commodity volatility and FX swings.
- Lower margins vs some peers: Margins are lower relative to top competitors such as Polycab and Havells in certain segments.
- Cash flow volatility: Periods of negative operating cash flow have been reported and need monitoring.
- Receivables & working capital: Receivables management and working capital cycles have shown stress points historically.
Opportunities
- Infrastructure push: Smart cities, power transmission, metro projects, renewable energy build-out.
- Rising demand for EHV cables: Infrastructure and grid upgrades raise demand for specialized cables.
- International expansion: Room to deepen exports (Europe, US) as supply chains diversify.
- Retail expansion: Growing retail share can improve margins and working-capital profile.
Threats
- Intense competition: Large players (Polycab, Havells, Finolex, RR Kabel) — and potential conglomerate entrants — increase pricing/market-share pressure.
- Raw material price volatility & FX risk: Fluctuations in copper/aluminum and currency moves can squeeze margins.
- Project delays: Dependency on infrastructure spending exposes revenue to execution/approval lags.
- Regulatory/tax risks: Ongoing GST dispute (₹118.07 crore demand for FY2017-18 to FY2020-21) is a material event to watch.
- Macro shocks & geopolitics: Supply-chain disruptions or economic downturns can reduce demand.
Fundamental analysis of KEI Industries
Revenue growth
KEI has shown strong top-line expansion driven by domestic infra demand, capacity increases and exports.
- Q1 FY26 (June 2025): Revenue rose ~26.5% YoY to ₹2,629.93 crore.
- 5-year CAGR (FY21–FY25): ~23.6% — indicating consistent multi-year growth.
- Segment diversity: LT cables and house wires historically make up a large chunk (~two-thirds in FY23), with EHV adding higher-margin exposure.
Profitability
- Net profit growth: Net profit grew ~30.28% YoY in June 2025 quarter (₹195.75 crore) and FY25 net profit rose ~19.9% YoY to ₹696 crore.
- Profit margins: Net margin around 7.2% in FY25 (flat vs FY24) — demonstrates reasonable cost control even when operating margins fluctuate.
- Return ratios: ROCE ~17.2% and ROE ~12.1% for FY25 (some decline from prior year but historical three-year ROCE average stayed strong around 25%).
Debt & liquidity
- Minimal leverage: Debt-to-equity ~0.03 (March 2025) — essentially near net debt-free, a structural strength for capital expenditure and cyclical downturns.
- Strong liquidity ratios: Current ratio ~4.18 (March 2025) and high cash/equivalents reported in June 2025.
- Cash flow caution: Cash flow from operations was negative in FY25 (~-₹322 million) after being strongly positive in FY24 (~₹6,105 million). This volatility requires attention (working capital swings / receivables timing are likely causes).
Valuation
- P/E: Trailing P/E ~52 (early October 2025) — well above industry median and many peers, indicating a premium valuation.
- Peer comparison: Higher than Polycab, RR Kabel and other mainstream peers on P/E — investors are pricing growth into KEI.
- Interpretation: Strong growth and low debt justify a premium to an extent, but current multiples suggest expectations are high and leaves little margin for execution shortfalls or macro setbacks.
Fundamentals — investor takeaway
KEI industries business fundamentals are strong: high revenue growth, improving profits, very low leverage and healthy returns historically. The caution points are cash-flow volatility, receivables/working capital management and the high valuation multiple which assumes continued high growth.
Technical analysis (market view as of early October 2025)
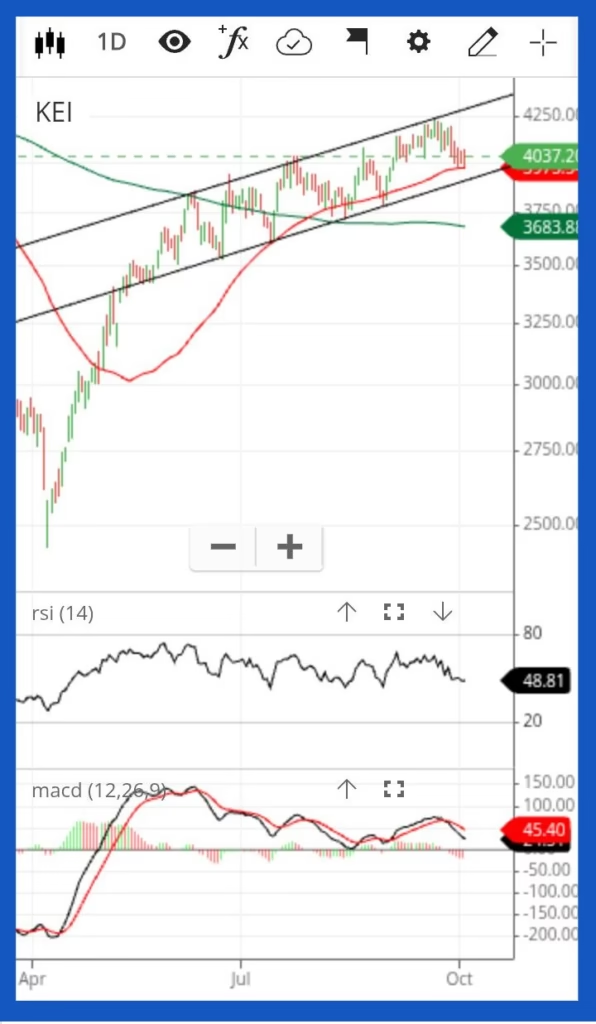
Chart Source : Zerodha Kite
Insight on KEI Industries Chart Analysis
KEI Industries is currently moving within a wide upward trendline channel, indicating a strong long-term structure.
Short-Term Trend:
The short-term momentum is down, but this decline appears to be a healthy correction within the broader uptrend. The price is approaching the 3900 level, which serves as both a psychological and channel support area. Given the strength of this wide channel, a trend reversal or bounce from this level is highly likely.
Intermediate-Term View:
The stock is testing the 50-day moving average (50 DMA) around ₹3973. Sustaining above this level could signal renewed buying interest.
Long-Term Trend:
The 200-day moving average (200 DMA) near ₹3683 remains well below the current price, confirming that the long-term trend is intact and bullish.
Indicators:
RSI (48.81) is hovering near neutral levels, indicating a potential base formation.
MACD is slightly negative, but not deeply bearish as it is above 0 line, suggesting the downtrend may be losing strength.
Key Insights:
The current setup offers a good accumulation opportunity for long-term investors. With strong channel support near ₹3900 and price above the 200 DMA, starting a SIP or gradual accumulation in KEI Industries looks favourable for those with a medium to long-term horizon.
Patterns & outlook
Earlier breakouts were associated with bullish patterns (double-bottom, falling-wedge) and upside targets around ₹4,200–₹4,300. Currently, the technical picture calls for caution: consolidation with possible short-term correction unless price decisively moves back above the 20-day EMA and reclaims ₹4,000+ support. Traders should use strict risk management because of elevated volatility.
What top investors & analysts think
Institutional holdings
- Institutional ownership: Increased to ~52.22% (June 2025 quarter) from ~49.34% previously — a bullish signal showing professional investor interest.
- Mutual funds & FIIs: Mutual funds ~23.71%, FIIs ~26.59% in June 2025 — large mutual fund and foreign holdings indicate conviction in growth prospects.
Analyst views & ratings
- Generally positive: Many brokerages maintain a bullish to buy outlook due to robust demand, capacity additions (Sanand plant) and export growth.
- Credit upgrade: ICRA upgraded to [ICRA]AA+ with Positive outlook (June 2025) — supportive of financial stability expectations.
- Valuation caution: Some analysts (e.g., MarketsMojo in Aug 2025) have flagged premium valuations and recommended Hold despite strong fundamentals.
- Price targets: Targets vary—examples include consensus targets in the ₹4,200–₹5,150 range depending on the analyst and growth expectations (see broker-specific reports for exact dated targets).
Investor takeaway
Institutional accumulation and positive analyst coverage support a constructive long-term narrative. However, elevated valuations and a few cautious analyst calls mean investors should balance growth optimism with valuation discipline.
Key growth drivers & risks (3–5 year view) of KEI Industries
Growth drivers
- Renewable energy build-out: India’s renewable capacity targets and solar/wind projects increase demand for specialized cables.
- Government infrastructure: NIP, smart cities, metros, railway electrification and transmission projects create steady demand.
- Digital infrastructure & EVs: 5G rollout, data-center expansion and EV charging infrastructure amplify cable demand.
- Retail & export expansion: Higher-margin retail growth and targeted exports (US/EU) under a China-plus-one dynamic.
- Capacity expansion: Sanand plant coming online to add EHV/HT/LT capacity, supporting future revenue growth.
Key risks
- Commodity & FX volatility: Copper/aluminum and currency swings can rapidly influence margins.
- Competition & pricing: Large incumbents and new conglomerate entrants could pressure pricing.
- Execution & working capital: Project delays, supply-chain bottlenecks and receivable cycles can hurt cash flows.
- Regulatory/tax disputes: The GST demand (~₹118.07 crore for FY2017-18 to FY2020-21) is a notable contingent liability to track.
Comparing KEI Industries with major competitors
Market share & positioning
Polycab is generally the market leader in organized cables with a materially higher market share (c. 26–27%). KEI industries is typically ranked near #2 or #3 with a lower share (estimates ~9% in organized market) but strong presence in industrial/EHV segments.
Valuation & financial strength
- Valuation: KEI Industries trades at a premium P/E (~52) versus many peers, implying higher growth expectations relative to the sector.
- Financial health: KEI Industries near-zero net debt is a differentiated strength; some peers may carry higher leverage but also benefit from larger scale or stronger retail presence.
- Margins: Certain peers (Polycab, Havells) may report higher margins in some retail segments due to scale, brand and product mix.
Takeaway
KEI industries competes well on technology/EHV capability and balance-sheet conservatism, but lags in sheer market share and sometimes in margin profile versus the largest competitors. Valuation premium reflects expectation of closing that gap via capacity and export expansion.
Market note (October 3, 2025)
Price & market action (Oct 3, 2025): The stock declined modestly by -0.60% relative to its sector and closed at ₹4,048.50. Open interest rose by ~15.7% vs previous day, indicating elevated trading interest. Analysts note the stock’s valuation is somewhat elevated — a factor for risk-aware investors.
Conclusion & investor checklist
KEI Industries is a high-quality business within the wires & cables ecosystem: strong revenue and earnings growth, leadership in EHV cables, near-debt-free balance sheet and improving exports/retail footprint. The primary caution is valuation — investors are paying a premium for future growth. Operational items to watch include cash flow conversion (CFO), receivables, raw material costs & the GST dispute.
Investment checklist (before buying)
- Are you comfortable with a premium valuation (trailing P/E ~52) and the expectations priced in?
- Monitor quarterly CFO and receivables — are working capital cycles improving after capacity additions?
- Track commodity prices (copper, aluminium) and FX movement — can management pass through costs?
- Watch the GST dispute resolution and potential contingent liabilities.
- If trading, use technical cues: reclaim of 20-day EMA and support around ₹4,000 for bullish bias; breakdown below ~₹3,970 for caution.
This post synthesizes the supplied company data and widely discussed market themes as of October 3, 2025. It is informational and should not be construed as investment advice. Always cross-check latest filings, broker reports, and your financial advisor before acting.
Further Reading:
Top Stock Pick 2025: Why Bharat Electronics Ltd is Powering India’s Defence Future
Bharat Electronics Ltd is a leading Indian public sector enterprise established in 1954, known for its significant contributions to defense and electronic systems.
Read More →