
Indian Stock Market on Friday 17 Oct 2025
The Indian equity market extended its upward momentum on Friday, with the Nifty 50 breaking above a key resistance level at 25,676 and closing 124.55 points higher (0.48%) at 25,709.85. The BSE Sensex followed suit, gaining 484.53 points (0.58%) to settle at 83,952.19.
The Bank Nifty also contributed to the bullish sentiment, climbing for the third consecutive session. It closed at 57,713.35, up 290.80 points (0.50%), signaling sustained strength in the banking space.
Among sectors, FMCG stocks led the rally, with the Nifty FMCG index jumping 1.36% to 5,616.40, fueled by strong buying in heavyweights Hindustan Unilever and ITC, both gaining over 1.5%. The index has now surged over 4% in the past three sessions, underscoring investors’ growing preference for defensive and stable sectors amid market volatility.
Topics of Discussion
Technical Analysis of Nifty 50
Description of the Nifty 50 Chart :
Candlestick Chart
This chart presents the Nifty 50 index in a candlestick format, based on daily market data — open, high, low, and close prices.
Among all chart types, the candlestick chart is the most widely used by active traders to analyze price behavior and market trends.
Candle Body and Wicks
Each candlestick represents one trading day:
Green candles indicate that the closing price is higher than the opening price.
Red candles show that the closing price is lower than the opening price.
The upper and lower wicks (or shadows) represent the day’s highest and lowest prices.
Moving Averages
Three Exponential Moving Averages (EMAs) are plotted to track price momentum and market trends:
- 20-Day EMA (Blue Line) – Short-term trend
- 50-Day EMA (Red Line) – Medium-term trend
- 200-Day EMA (Green Line) – Long-term trend
These EMAs help identify trend direction, crossovers, and possible support/resistance zones.
Trend Lines, Support & Resistance Levels
Black lines are used to highlight key technical levels:
Horizontal lines mark support or resistance levels.
Sloping lines represent trend lines showing upward, downward, or sideways market direction.
These lines help traders recognize potential breakout or reversal zones.
Technical Indicators
Below the main chart, three commonly used momentum and trend indicators are displayed.
- Relative Strength Index (RSI – 14)
Based on closing prices of the last 14 days.
Above 70 – Overbought condition
Below 30 – Oversold condition
Around 50 – Neutral zone
RSI helps determine whether the market is overextended in either direction.
- Moving Average Convergence Divergence (MACD – 12, 26, 9)
Black Line: 12-day EMA minus 26-day EMA
Red Line: 9-day EMA of the black line (signal line)
When the black line crosses above the red line → bullish signal.
When it crosses below → bearish signal.
- Stochastic Oscillator (14, 3, 3)
Calculated from the 14-day high and low:
Black Line: Fast Stochastic (first smoothing)
Red Line: Slow Stochastic (second 3-day smoothing)
Interpretation:
Above 80: Overbought
Below 20: Oversold
Around 50: Neutral
Together, these indicators provide a complete technical picture of Nifty 50, helping traders identify optimal entry and exit points.
Interpretation of the Chart
Higher Highs and Lows
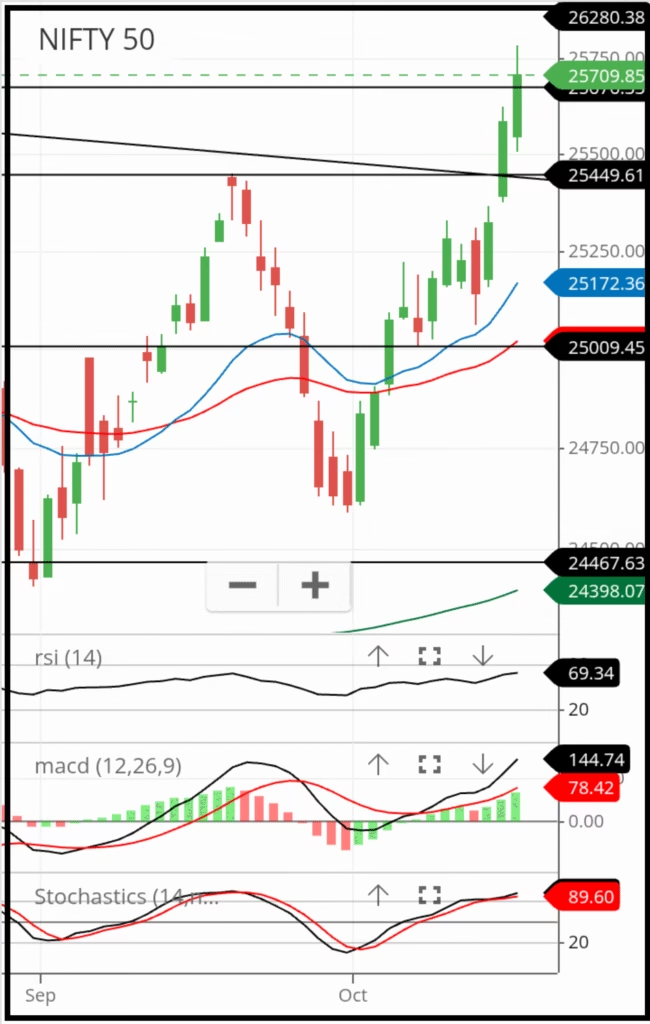
Nifty 50 has formed consecutive higher highs and higher lows over the past three sessions — a classic sign of a strong uptrend and improving investor confidence.
Major Resistance Breakouts
In the last 15 days, Nifty 50 has broken through three key resistance levels — 25,000, 25,449, and 25,676.
These breakouts confirm strong buying pressure and reinforce the bullish momentum.
Nifty Resistance and Support Levels
| Resistance | Support |
| 26,000 | 25,676 |
| 26,277 | 25,449 |
| 26,500 | 25,000 |
Trend Line Breakout
The index has also broken a trendline drawn from the all-time high of 26,277.35.
This breakout signals a potential new upward phase, visible more clearly in the weekly chart.
Price Above Moving Averages
Current Nifty 50 close: 25,709.85
20-day EMA: ~25,172
50-day EMA: ~25,000
200-day EMA: ~24,500
The large gap above all EMAs reflects strong bullishness, though it also hints at a possible short-term consolidation.
RSI Near Overbought Zone
RSI (14) = 69.34, approaching the overbought mark of 70.
While momentum remains strong, a temporary pullback cannot be ruled out.
MACD Shows Bullish Signal
MACD Value: 144.74
Signal Line: 78.42
Both lines show positive divergence, confirming that the intermediate trend supports the short-term uptrend.
Stochastic in Overbought Territory
Both Fast and Slow Stochastic readings are around 89.6, indicating an overbought market.
A minor correction or retracement may occur in the coming sessions.
Insights of Nifty 50’s Analysis
The short-term outlook for Nifty 50 remains decisively bullish, supported by trendline and resistance breakouts.
However, with momentum indicators nearing overbought levels, volatility may increase in the coming week.
A pullback toward 25,676 or 25,449 would be healthy within the broader uptrend.
Traders should use strict stop-losses to protect profits and manage risks effectively during this high-momentum phase.
Also Read


Technical Analysis of Bank Nifty
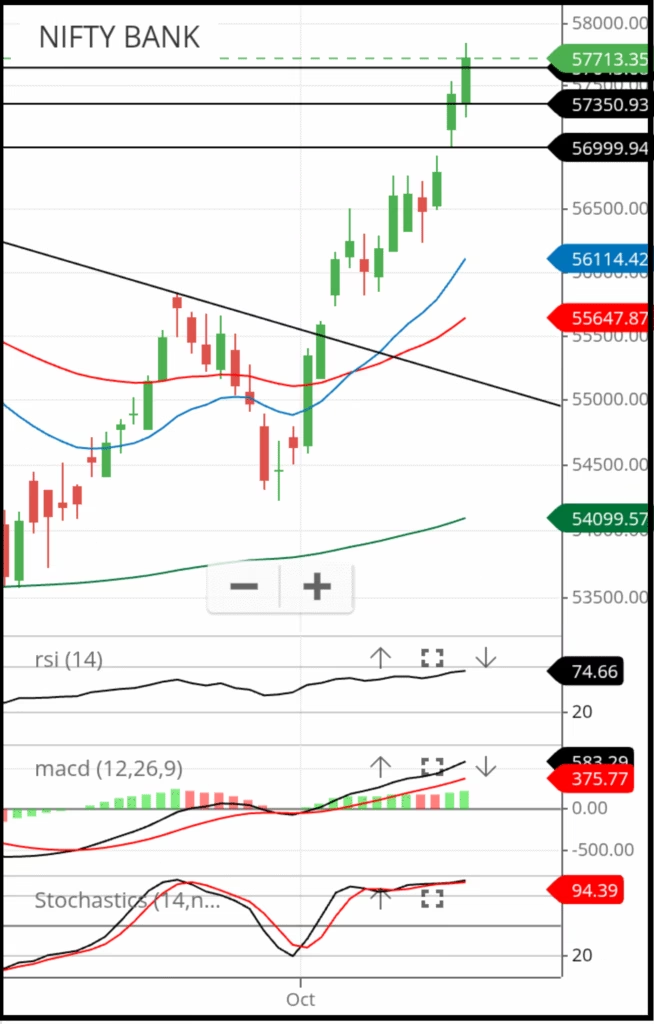
Chart Description of Bank Nifty:
This chart mirrors the layout of the Nifty 50 chart, but focuses on Bank Nifty data instead of Nifty 50. It plots the Bank Nifty’s open, high, low, and close values instead of nifty 50 values. To ensure the full trend is visible, the chart is presented in a slightly more condensed view compared to the Nifty 50 chart.
Interpretation of the Chart
Highs and Lows
The Bank Nifty index has been forming higher highs and higher lows consecutively over the past three trading sessions.
This consistent pattern is a clear indication of a strong uptrend and reflects growing market confidence.
Resistance Break
Over the last 3 days, the Bank Nifty has broken through three major resistance levels — 57,000 (a strong psychological barrier), 57,350, and 57,628( Previous 52 week high)
Successfully crossing these resistance zones further reinforces the bullish momentum and indicates strong buying pressure in the market.
Bank Nifty Resistance and Support Levels
| Resistance | Support |
| 57,830 | 57,623 |
| 58,000 | 57,350 |
| 58,500 | 57,000 |
Trend Line Break
The Bank index has also broken a key trendline that was drawn from its all-time high of 57,628.4.
This breakout is an important technical event that suggests the market could be entering a new upward phase.
The full view of this trendline can be observed more clearly in the weekly chart shown below.
Price Far Above Moving Averages
The current price of the Bank Nifty stands at 57713.35.
In comparison:
The 20-day EMA is around 56,114.42
The 50-day EMA is near 55,647.87
The 200-day EMA is around 54,074.80
This wide gap between the moving averages and the current price indicates extreme bullishness.
However, such a steep rise also suggests that a short-term correction or consolidation may occur before the next leg of the rally.
RSI (14) in Overbought Territory
The Relative Strength Index (RSI 14) currently stands at 74.67, which is inside the overbought level of 70 and 100.
This suggests that while the momentum remains strong, a short-term pullback cannot be ruled out as the market may need to cool off temporarily.
MACD Signal Buy
The MACD, which reflects the intermediate-term trend, shows a strong positive setup.
The MACD value is 583.39,
The signal line stands at 375.77.
Both lines are displaying positive divergence, indicating that the intermediate trend is aligned with the ongoing short-term uptrend.
This confirms that the market’s bullish momentum is not only intact but also strengthening.
Stochastic (14, 3, 3) Overbought:
Both the Fast Stochastic and Slow Stochastic indicators are currently in the overbought zone, with readings around 94.39.
This level signals that the short-term rally may be losing steam, and a pullback or minor correction could occur soon.
A price retracement in the coming week is therefore highly possible.
Insights of Bank Nifty’s Analysis
The trend of Bank Nifty remains decisively upward, but traders should be cautious of a possible pullback towards 57,673, 57,350 or even 57000 in the next week. Also traders should be careful as the bank nifty is moving towards a strong psychological Resistance level of 58,000.
With Stochastics in overbought territory, volatility is expected to rise.
The upcoming week will be crucial to maintain the current bullish momentum.
Traders are strongly advised to use strict stop-loss levels to protect profits and manage risk effectively in this highly dynamic phase.
Frequently Asked Questions (FAQs)
1. What’s your view on Monday’s market?
Nifty and Bank Nifty are currently in a strong bullish phase. However, a near-term correction is expected, so investors should remain cautious and watch key levels.
2. What are the resistance levels of Nifty 50?
The immediate resistance levels for Nifty are 26,000 (psychological level) and 26,277 (all-time high). Breaking these levels could signal further upward momentum.
3. What are the support levels of Nifty 50?
Key support levels for Nifty are 25,676, 25,449, and 25,000 (psychological level). These levels may act as strong buying zones in case of a pullback.
4. What are the resistance levels of Bank Nifty?
Bank Nifty faces resistance at 57,830.2 (all-time high) and 58,000 (psychological level). Traders should monitor these levels for potential profit booking.
5. What are the support levels of Bank Nifty?
The support levels for Bank Nifty are 57,623, 57,350, and 57,000 (psychological level). These zones could provide strong buying interest during corrections.
6. Which sectors are currently looking positive?
Sectors showing strong momentum are Banking, Financial Services, Auto, and Pharma. Investors may focus on these sectors for potential opportunities in the near term.
Disclaimer
The information provided on this website is for educational and informational purposes only. It should not be considered as financial, investment, or trading advice. The views and analyses expressed are based on publicly available data and personal research and are not recommendations to buy, sell, or hold any securities.
Investing in the stock market and mutual funds involves risks, including the possible loss of principal. Past performance is not indicative of future results. Readers are encouraged to conduct their own research or consult a qualified financial advisor before making any investment decisions.
The website owner and authors shall not be held liable for any direct or indirect losses arising from the use of the information provided here. By using this site, you agree that you are solely responsible for your investment actions.