

Introduction
This week’s Bank Nifty Prediction for 24, 25, 26, 27 & 28 November feels like opening a new chapter in the market’s unfolding story. Bank Nifty stands at a crucial point — a place where technical signals, price behaviour, and trader psychology come together to hint at the next big move. As we step into this trading week, the index brings with it clues hidden in trendline strength, channel direction, RSI, Stochastics, EMAs, and MACD, each indicator telling its own part of the narrative.
Just like every chapter builds on the previous one, this week’s outlook is shaped by last week’s performance and the broader six-month structure of the market. The support and resistance levels act like signposts on this road, guiding traders through short-term swings, medium-term positioning, and the long-term direction of the Bank Nifty.
And as the plot thickens, we also introduce our curated list of 5 stocks to buy this week — picks supported by data, discipline, and technical clarity. The story wouldn’t be complete without highlighting why the Bank Nifty is so important in determining the trend direction of the Nifty 50, making it the true driving force behind India’s market narrative.
Topics of Discussion
Story of Bank Nifty
Imagine the Indian stock market as a vast city—alive, evolving, always in motion. At its center stands a towering financial district, and the Bank Nifty is its heartbeat. Long before the broader Nifty 50 makes a decisive move, it is usually Bank Nifty that whispers the first signal—sometimes quietly through subtle higher lows, sometimes loudly through explosive breakouts. Traders often say: “If you want to understand the market’s next move, follow the banks.”
As 2025 approaches its final weeks, the heartbeat is strong. Credit growth is firm, bank earnings are steady, and investor confidence is returning with every new data release. The signs of resilience are not random; they are part of a larger story unfolding beneath the charts—one of stability, growth, and long-term structural strength.
This report – covering 20 November to 31 December 2025 – is built on that story. It walks through trend formations, critical levels, expected closing ranges, and even stretches ahead into a 15-year outlook, imagining where the financial giant called Bank Nifty could stand by 2040 based on past cycles and realistic growth trajectories.
The Weight of Banking Stocks — A Silent Power Behind Nifty 50
Think of the Nifty 50 as a long-distance runner. Now imagine the banking sector as the strong legs that carry that runner forward. By late 2025, these legs have grown especially powerful.
Pure banking stocks alone contribute 20.39% of the entire index. But when you widen the lens and include NBFCs, insurers, and lending institutions, the financial services sector expands to nearly 36–37%. This makes it the largest force shaping every rise, fall, pause, and breakout within the Nifty 50.
Every six months, the index undergoes a recalibration—something like a health check-up where weights shift based on performance and market value. Yet despite these adjustments, one truth remains constant: Banks dominate the Nifty.
A Closer Look at India’s Financial Backbone
Inside this influential sector are five giants—household names that move markets daily:
HDFC Bank (~7.35%) – The consistent performer, India’s largest private-sector bank.
ICICI Bank (~4.73%) – Stable, growing, and increasingly preferred by institutions.
SBI (~4.32%) – The trusted backbone of India’s public sector banking.
Kotak Mahindra Bank (~2.00%) – The strategic, quality-focused lender.
Axis Bank (~1.89%) – The turnaround story that continues to strengthen year by year.
Together, these five alone command more than one-fifth of the Nifty 50’s total weight. When they rise, the entire market feels lighter. When they slip, the rest of the index struggles to keep pace.
Why This Matters — The Story Beneath the Numbers
Financials are not just another sector. They are the bloodstream of economic activity. Every business loan, home loan, credit line, or corporate investment flows through these institutions.
So when bank stocks start trending strongly—driven by credit expansion, healthier balance sheets, improving NPAs, or favorable RBI policies—the entire market receives a tailwind.
But this power works both ways.
Just as strong banks can pull the market upward, any weakness can drag the entire index down within hours.
For investors tracking long-term shifts or short-term trading setups, staying updated with the official Nifty 50 fact sheets and weightage updates becomes essential. It’s like reading the weather report before setting sail.
Current Trend — The Market’s Mood Going Into Year-End
As we step into late 2025, the Bank Nifty is quietly drawing a narrative through its candles:
Higher lows shaping on the weekly chart — a sign of strength building beneath the surface.
PSU banks providing surprising leadership — sectors once ignored are now supporting the index with consistent momentum.
Private banks posting stable quarterly results — reinforcing long-term stability.
Overall sentiment turning optimistic — especially with year-end flows approaching.
FII behaviour becoming a wildcard — any surge or pullback in foreign money can create short-term volatility.
In simple words, the stage is set.
The market’s financial engine is humming, the trend structure is constructive, and the final weeks of 2025 look poised for meaningful action.
Current Trend Overview
- Bank Nifty is forming higher lows on the weekly chart
- PSU banks continue to support the index
- Private banks show stable quarterly results
- Market sentiment remains positive ahead of year-end flows
- FII activity will play a key role in short-term volatility
The Table 1 below shows the direction of the trends of Bank Nifty in different time frames.
Table 1 : Direction of Trends of Bank Nifty
| Trend Type | Chart Used | Direction of Trends |
|---|---|---|
| Short Term Trend | Daily | UP |
| Intermediate Term Trend | Weekly | UP |
| Long Term Trend | Monthly | Up |
Weekly Performance and Trends
The Bank Nifty index continued to demonstrate resilience during the week ending 14th November 2025, despite minor fluctuations in daily movements. The index opened at 58,696.30 and closed marginally lower at 58,867.70, recording a positive weekly change of 0.60%, which reflects market stability after weeks of steady gains.
From a trend perspective, the Nifty 50 market sentiment remains positive across all time frames — short-term (daily), intermediate (weekly), and long-term (monthly) charts continue to show an upward trajectory. This sustained uptrend highlights strong participation from bank stocks, with investors maintaining confidence in the segment’s growth potential.
As the market heads into the week of 24th to 28th November 2025, the technical structure suggests ongoing strength, though selective consolidation may occur at higher levels. In this analysis, we will examine the technical summary, key patterns, and best stock opportunities within the Nifty index to identify areas where investors can consider buying on dips or adding quality Bank names for medium-term gains.
Table 2 : Weekly Performance of Bank Nifty Index
| Particulars | Value |
|---|---|
| Open | 58,696.30 |
| High | 59,440.10 |
| Low | 58,605.30 |
| Close | 58,867.70 |
| Previous Close | 58,517.55 |
| Gain | +350.15 |
| Gain % | +0.60 |
Technical Analysis of Bank Nifty
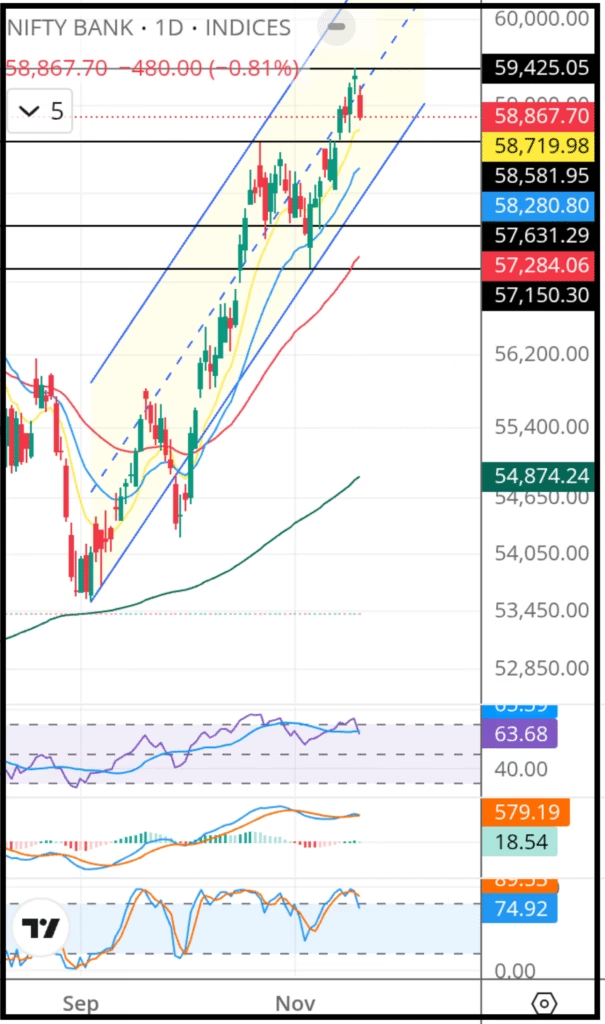
Chart Source : Trading View
Chart Description
Candlestick Chart
This is a daily candlestick chart of the Bank Nifty index. Details and how to read the chart is shown in the article below

Nifty 50 : Prediction for 10th to 14th November 2025 with Factors Affecting it’s Performance
Nifty 50 weekly analysis: After breaking the 25,686 resistance and crossing 26,000, the index faced a short-term pullback to 25,318. While the intermediate and long-term trends remain bullish,...
Read More →Chart Inference:
Chart Pattern
The Chart shows that the prices are moving between a fixed uptrending channel.
Bank Nifty is continuously creating higher highs and higher lows since 1st October 2025.
Support & Resistance Commentary
The Bank Nifty is currently positioned near multiple resistance levels, marked at 59,425, 60,000, and 60,500.
In the near term, the immediate resistance lies at 59,425. If the index successfully breaches 59,425 on a closing basis, we may expect a further upward move toward the next resistance zone at 60,000.
Should the momentum continue and the index manage to sustain above 60,000, the next potential upside target becomes 60,500.
On the downside, the index has three key support levels placed at 58,582, 57,631 and 57,150.
If the index slips below the support at 58,582, the next likely downside test would be the zone around 57,631.
A further breakdown below 57,631 may drag the index toward the deeper support at 57,150, which is expected to act as a stronger cushion unless a major trend reversal takes place.
Table 3 : Supports And Resistances of Bank Nifty
| Support 3 | 57,150 |
| Support 2 | 57,361 |
| Support 1 | 58,582 |
| Closing | 58,867.70 |
| Resistance 1 | 59,425 |
| Resistance 2 | 60,000 |
| Resistance 3 | 60,500 |
Interpretation of EMAs (20, 50, 200)
The price is currently above the 20 EMA, indicating a short-term bullish trend.
The price is currently above the 50 EMA, indicating an intermediate-term bullish trend.
The price is currently above the 200 EMA, indicating a long-term bullish trend.
Additionally, the 20 EMA is above the 50 EMA, which confirms a bullish intermediate trend.
The 50 EMA is above the 200 EMA, which confirms a bullish long-term trend.
When all three EMAs are aligned in the same direction (20 > 50 > 200 for bulls or 20 < 50 < 200 for bears), it strengthens the trend and reduces the probability of false signals.
Table 4 : Exponential Moving Averages (EMAs)
| EMA | Value | Comments | Inference |
|---|---|---|---|
| EMA – 10 | 58,720 | Below close & EMA(10)>EMA(20) | BUY |
| EMA – 20 | 58,280 | Below close & EMA(20)>EMA(50) | BUY |
| EMA – 50 | 57,284 | Below close & EMA(50)>EMA(200) | BUY |
| EMA – 200 | 54,874 | Below close & EMA(50)>EMA(200) | BUY |
Interpretation of RSI (14)
The current RSI (14) value is 63.68 . Since the RSI is above the 50-level threshold, market momentum currently favors the bulls.
The indicator is falling from the overbought, which suggests a potential short-term pullback. Traders should exercise caution and avoid initiating aggressive short positions at this stage. Instead, the preferred strategy is to buy on dips until the indicator cools off and confirms a clearer trend.
Interpretation of Stochastics
The current Stochastics (14) value is 89.53 & 74.92(Fast & Slow) . Since the Stochastics is above the 50-level threshold, market momentum currently favors the bulls.
The indicator is in or leaving the overbought zone, which suggests a potential short-term pullback. Traders should exercise caution and avoid initiating aggressive short positions at this stage. Instead, the preferred strategy is to buy on dips until the indicator confirms a clearer trend.
Interpretation of MACD
The MACD value is currently 579.19, which is above the zero line. This indicates that the market is presently under the control of the bulls.
The MACD line (black) is coinciding with the signal line (red), which further confirms a neutral momentum shift. As long as there is a real crossover, the prevailing trend is expected to be range bound or neutral.
However, if the MACD line begins to move upward away from the signal line, traders should be alert for a possible increase in momentum and signal a fresh buying opportunity.
Table 5 : Indicators
| Indicator | Value | Comments | Inference |
|---|---|---|---|
| RSI | 63.68 | leaving the overbought territory | SELL |
| Stochastics | 89.53- Fast 74.92- Slow | Overbought | SELL |
| MACD | 579.19 | Main line & signal line coinciding | NEUTRAL |
Technical Outlook:
Table 6 : Overall Technical Summary
| Object | Comments | Final Verdict |
|---|---|---|
| Trendline | In Upward Channel | BUY |
| EMAs | All trends Up | BUY |
| RSI | Downward slope | SELL |
| Stochastics | Overbought | SELL |
| MACD | Not Clear | NEUTRAL |
| Overall Outlook | A correction in near term | BUY IN EVERY DIPS |
Conclusion: What This Technical Setup Suggests
The overall technical structure presents a balanced yet opportunity-rich scenario for traders and investors. While price action remains firmly within an upward trendline channel and supported by bullish EMAs, indicating strength in the broader trend, momentum indicators such as RSI and Stochastics are signaling short-term exhaustion and the possibility of a near-term correction.
The MACD staying neutral adds to the expectation that the market may pause or pull back slightly before resuming its upward journey.
Medium to Long-Term View: Bullish continuation remains intact
Short-Term View: A healthy dip or minor correction is likely
This combination creates a strategic environment where buying on dips becomes the most favourable approach, allowing traders to participate in the larger upward trend while taking advantage of temporary price weakness. In simple terms:
👉 Markets may cool off briefly
👉 But the broader trend is still up
👉 Every meaningful dip offers a buying opportunity
Therefore, the final takeaway aligns with the summary:
✅ Overall Outlook: Buy on every dip within the upward channel
Bank Stocks to Buy this Week
Please refer to the article below. In the last part of article buying price, stoploss limit price and expected price is illustrated in a tabular format.

Nifty 50 Prediction for 24, 25, 26, 27 & 28 November with Trends, Resistances and Weekly Performance
📌 “Part of the Nifty Weekly Prediction Package – Click below to explore all predictions”

Read More


Weekly Close: 58,867.70
(Change: +359.15 points(+0.60%)