

Introduction
Bank Nifty Prediction for 17–21 November 2025 comes at a crucial time as traders closely track market sentiment, resistance levels, support zones, weekly performance, and sector strength. With banking stocks showing mixed signals in the recent sessions, understanding the short-term trend, medium-term trend, and long-term trend becomes essential before the next trading week begins. This prediction report provides a data-backed outlook to help traders prepare effectively and make informed decisions for the upcoming week.
Topics of Discussion
Last Week’s Performance (10th to 14th November 2025)
Weekly Performance
The Bank Nifty index continued to demonstrate resilience during the week ending 14th November 2025, despite minor fluctuations in daily movements. The index opened at 57,846.2 on Monday and closed higher at 58,517.55 on Friday, recording a positive weekly change of 1.11%, which reflects market stability after weeks of steady gains.
Table 1 : Weekly Performance of Bank Nifty Index
| Particulars | Value |
|---|---|
| Open | 57,846.2 |
| High | 58,615.95 |
| Low | 57,594.25 |
| Close | 58,517.55 |
| Previous Close | 57,876.80 |
| Gain | 640.75 |
| Gain % | 1.11 |
Short Term Trend, Medium Term trend & Long Term Trend
From a trend perspective, the Bank Nifty’s market sentiment remains positive across all time frames — short-term (daily), intermediate (weekly), and long-term (monthly) charts continue to show an upward trajectory. This sustained uptrend highlights strong participation from bank stocks, with investors maintaining confidence in the segment’s growth potential.
Table 2 : Snapshot of Bank Nifty Trends
| Time frame | Chart used | Trend Direction |
|---|---|---|
| Short Term | Daily | Up |
| Intermediate Term | Weekly | Up |
| Long Term | Monthly | Up |
As the market heads into the week of 17th to 21st November 2025, the technical structure suggests ongoing strength, though selective consolidation may occur at higher levels. In this analysis, we will examine the technical summary, key patterns, and best stock opportunities within the Bank Nifty index to identify areas where investors can consider buying on dips or adding quality names for medium-term gains.
Technical Analysis of Bank Nifty
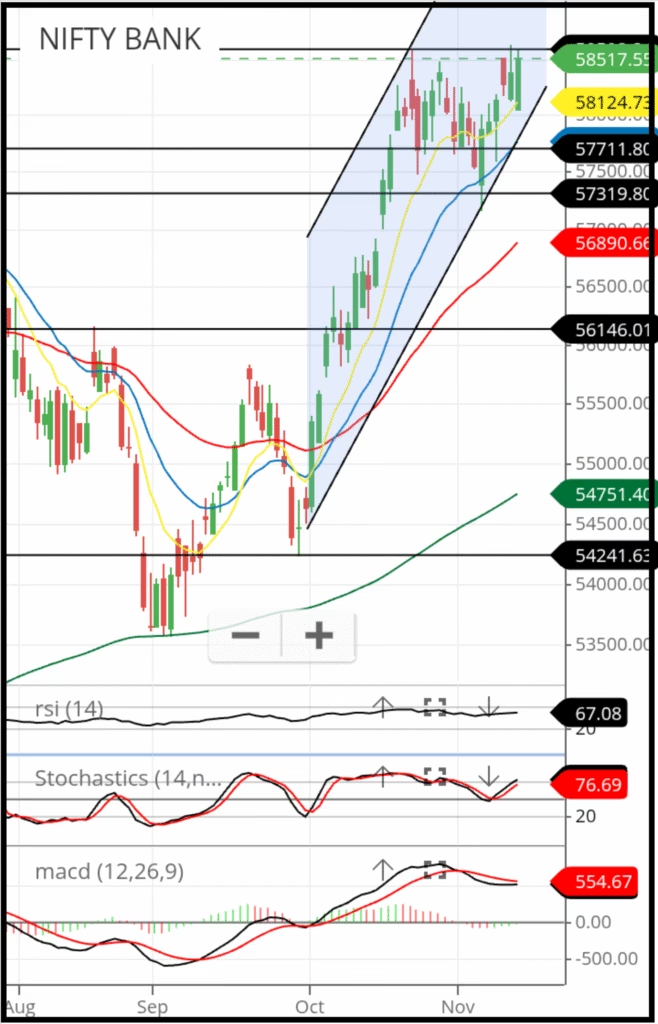
Chart Description
This is a daily candlestick chart of the Bank Nifty index. Details and how to read the chart is shown in the article below

Nifty 50 : Prediction for 10th to 14th November 2025 with Factors Affecting it’s Performance
Nifty 50 weekly analysis: After breaking the 25,686 resistance and crossing 26,000, the index faced a short-term pullback to 25,318. While the intermediate and long-term trends remain bullish,...
Read More →Candlestick Chart
This is a daily candlestick chart of the Bank Nifty index. Details and how to read the chart is shown in the article below.
Chart Inference
Chart Pattern
The Chart shows that the prices are moving between a fixed uptrending channel.
Bank Nifty is continuously creating higher highs and higher lows since 1st October 2025.
Support & Resistance Commentary
The Bank Nifty is currently positioned near multiple resistance levels, marked at 58,593, 59,000, and 59,500
In the near term, the immediate resistance lies at 58,953. If the index successfully breaches 58,953 on a closing bas is, we may expect a further upward move toward the next resistance zone at 59,000.
Should the momentum continue and the index manage to sustain above 59,000, the next potential upside target becomes 59,500.
On the downside, the index has three key support levels placed at 57,711, 57,319 and 56,146.
If the index slips below the support at 57,511, the next likely downside test would be the zone around 57,319.
A further breakdown below 57,319 may drag the index toward the deeper support at 56146 which is expected to act as a stronger cushion unless a major trend reversal takes place.
Table 3 : Supports And Resistances of Bank Nifty
| Support 3 | 56,146 |
| Support 2 | 57,319 |
| Support 1 | 57,711 |
| Closing | 58,517.55 |
| Resistance 1 | 58,593 |
| Resistance 2 | 59,000 |
| Resistance 3 | 59,500 |
Interpretation of EMAs (20, 50, 200)
The price is currently above the 20 EMA, indicating a short-term bullish trend.
The price is currently above the 50 EMA, indicating an intermediate-term bullish trend.
The price is currently above the 200 EMA, indicating a long-term bullish trend.
Additionally, the 20 EMA is above the 50 EMA, which confirms a bullish intermediate trend.
The 50 EMA is above the 200 EMA, which confirms a bullish long-term trend.
When all three EMAs are aligned in the same direction (20 > 50 > 200 for bulls or 20 < 50 < 200 for bears), it strengthens the trend and reduces the probability of false signals.
Table 4 : Exponential Moving Averages (EMAs)
| EMA | Value | Comments | Inference |
|---|---|---|---|
| EMA – 10 | 58,124 | Below Price | Buy |
| EMA – 20 | 57,772 | Below Price | Buy |
| EMA – 50 | 56,890 | Below Price | Buy |
| EMA – 200 | 54,751 | Below Price | Buy |
Interpretation of RSI (14)
The current RSI (14) value is 67.08 . Since the RSI is above the 50-level threshold, market momentum currently favors the bulls.
The indicator is approaching overbought zone, which suggests a potential an upward movement . Traders should exercise caution and avoid initiating aggressive short positions at this stage. Instead, the preferred strategy is to buy and hold until the indicator reached above 70 ( Overbought region)
Interpretation of Stochastics
The current Stochastics (14) value is 76.69. Since the Stochastics is above the 50-level threshold, market momentum currently favors the bulls.
The indicator is approaching overbought zone, which suggests a potential an upward movement. Traders should exercise caution and avoid initiating aggressive short positions at this stage. Instead, the preferred strategy is to buy and hold until the indicator reaches overbought territory above 80
Interpretation of MACD
The MACD value is currently 554.67, which is above the zero line. This indicates that the market is presently under the control of the bulls.
Additionally, the MACD line (black) is converging towards the signal line (red), which further confirms a bullish momentum shift. If there is a crossover within 1 to 2 trading days the prevailing uptrend is expected to continue.
However, MACD line has begun to converge toward the signal line, traders should be alert for a possible gain of momentum. A confirmed crossover would signal a buying opportunity.
Table 5 : Indicators
| Indicator | Value | Comments | Inference |
|---|---|---|---|
| RSI | 67.08 | Close to 70 Level | Buy |
| Stochastics | 76.69 | Close to 80 Level | Buy |
| MACD | 554.67 | Bullish crossover likely | Buy |
Technical Outlook:
Table 6 : Overall Technical Summary
| Object | Comments | Final Verdict |
|---|---|---|
| Trendline | up trending | Buy |
| EMAs | Below Price | Buy |
| RSI | Close to 50 | Buy |
| Stochastics | Close to 50 | Buy |
| MACD | Converging | Buy |
| Overall Outlook | Buy And Hold | Buy |
Conclusion : Key Insights
The technical indicators collectively present a cautiously optimistic outlook for the market. The up-trending trendline, supportive EMA positioning, and a converging MACD all signal underlying bullish strength, resulting in multiple Buy verdicts. At the same time, RSI and Stochastics hovering near the Overbought mark indicate a Upward momentum phase, suggesting that immediate directional clarity is upward. Bringing all elements together, the overall outlook remains “Buy and Hold”, (or “buy value stock” like mentioned in the last section of this article) implying that while the market bias is positive, disciplined risk management is essential to safeguard against potential volatility.
Bank Stocks to Buy This Week
Given the sustained resilience in the Bank the following stocks have been selected from this sector for the upcoming week. Projection prices are shown in the table 7 below.
- HDFC Bank
- Axis Bank
- Kotak Mahindra Bank
- ICICI Bank
- State Bank of India
These stocks represent high-quality businesses available at reasonable valuations, selected in line with the investment principles of Warren Buffett and Charlie Munger. Each has the potential to compound consistently over the years. Both technical and fundamental analysis currently support a positive outlook for these picks.
Table 7 : Projection for Nifty Bank Stocks
| Name of Stock | Closing Price (₹) 14/11/2025 | Projection prices (₹) |
| HDFC Bank | 989.6 | 1,115 |
| Axis Bank | 1,241.6 | 1,365 |
| Kotak Mahindra Bank | 2,079.7 | 2,250 |
| ICICI Bank | 1,373.0 | 1,510 |
| State Bank of India | 967.9 | 1,100 |
Read More


Weekly Close: 58,517.55
(Change: +640.75 points(+1.11%)