
Support and Resistance: The Foundation of Technical Analysis
Support and Resistance are two of the most fundamental concepts in technical analysis. Whether you are an intraday trader, swing trader, or long-term investor who uses chart levels for better entries, understanding these two zones can significantly improve your decision-making.
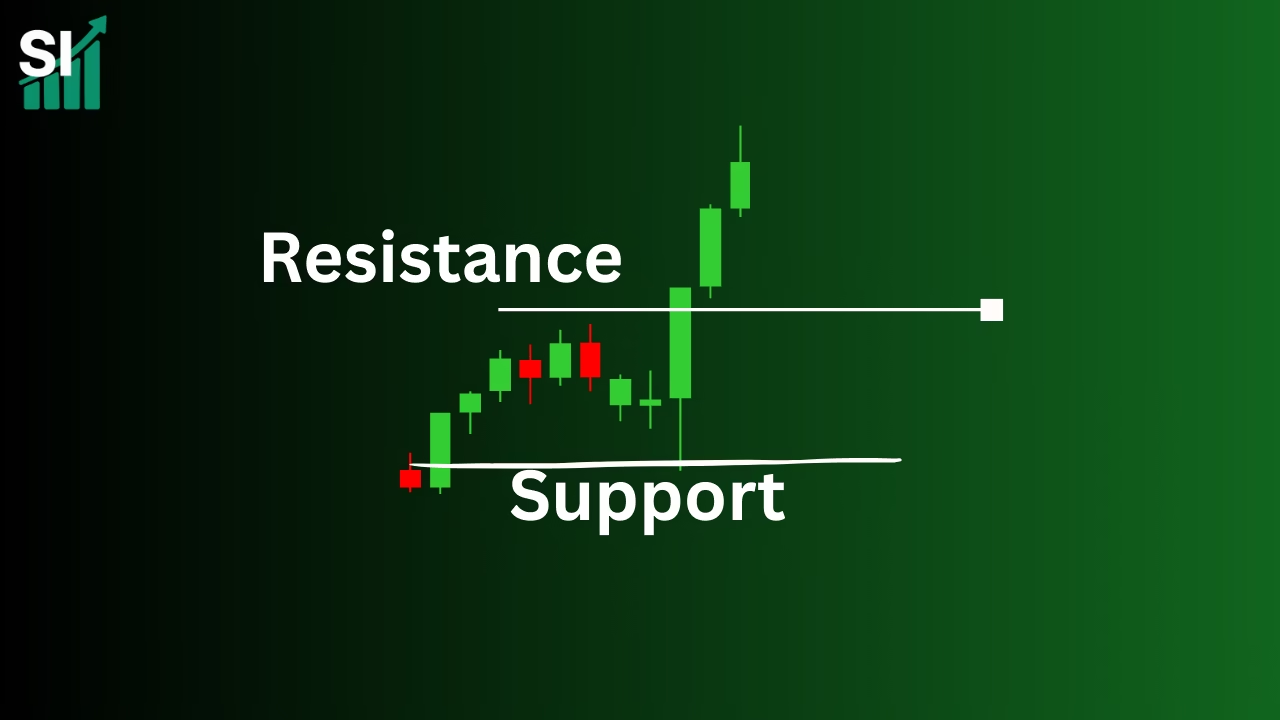
In simple words, Support is where the price tends to stop falling, and Resistance is where the price tends to stop rising. These levels act like psychological barriers, created by market participants and visible across all timeframes.
Topics of Discussion
✅ What Is Support?
Support is a price level where buying pressure is strong enough to prevent the price from falling further.
Think of it as a “floor” for the market.
Why support forms
- Traders start seeing value at lower levels.
- Institutions may accumulate more at discounted prices.
- Short-sellers book profits, adding buying pressure.
- Previous reversal zones become strong reference points.
What happens when support holds
- The price bounces upward.
- Bullish sentiment increases.
- Traders initiate long positions.
What happens when support breaks
- Panic selling can occur.
- Price rapidly drops to the next support.
- Trend shifts downward in the short term.
✅ What Is Resistance?
Resistance is a price level where selling pressure overpowers buying pressure.Think of it as a “ceiling” for the market.
Why resistance forms
- Traders consider the price too high.
- Institutional investors may start offloading at premium levels.
- Profit-booking creates selling pressure.
- Previous rejection zones remain psychologically important.
When resistance holds
- Price gets rejected.
- Momentum weakens.
- Traders initiate short positions or book long profits.
When resistance breaks
- A breakout occurs.
- Price may rise sharply.
- New buyers jump in as confidence increases.
🔍 How to Identify Support and Resistance Levels
There are multiple ways to identify these zones:
- 1. Historical Price Levels
Look for previous areas where price reversed multiple times.
More touches → Stronger level.
- 2. Moving Averages
- Dynamic support/resistance. Commonly used:
- 20 EMA
- 50 EMA
- 200 EMA
- Example: Nifty takes support at 20 EMA during uptrends.
- 3. Trendlines
An upward trendline acts as support.
A downward trendline acts as resistance.
- 4. Fibonacci Retracement
Retracement levels like 38.2%, 50%, and 61.8% often act as support or resistance.
- 5. Psychological Levels
Round numbers (like 26,000 for Nifty, 60,000 for Bank Nifty) work as psychological barriers.
📌 Role of Support and Resistance in Trading
Support and resistance are essential for:
- 1. Entry Points
Buy near support. Sell near resistance.
- 2. Stop-Loss Placement
Below support for long positions. Above resistance for short positions.
- 3. Trend Confirmation
Repeated breaks of support = downtrend continuation. Repeated breaks of resistance = uptrend continuation.
- 4. Breakout and Breakdown Trading
When the price breaks key levels decisively, strong moves follow.
🎯 Types of Support and Resistance
- 1. Static Support/Resistanc
Fixed horizontal levels — previous highs/lows, swing points.
- 2. Dynamic Support/Resistance
Levels that move with price — EMAs, trendlines, channels.
- 3. Zone-Based Support/Resistance
Price rarely reacts at exact numbers; it reacts in “zones”.
Example:
Support Zone: 25,850–25,900
Resistance Zone: 26,200–26,250
- 4. Major vs Minor Levels
Major levels: Valid on daily/weekly charts.
Minor levels: Seen on shorter intraday time frames.
📘 How Traders Use Support & Resistance
- 1. Bounce Trading
Price approaches support → Buy.
Price approaches resistance → Sell.
- 2. Breakout Trading
Price closes above resistance → Enter long.
Price closes below support → Enter short.
- 3. Pullback Trading
After a breakout, the old resistance becomes new support (role reversal).
Example : Nifty breaks 26,000 → retests → moves to 26,300.
Common Mistakes to Avoid
- Expecting support/resistance to work every time.
- Not waiting for confirmation (candlestick close).
- Confusing minor levels with major levels.
- Ignoring volume during breakouts.
- Trading exact numbers instead of zones.
🧠 Why Support and Resistance Work
Support and resistance work because of market psychology:
- Buyers remember where prices bounced.
- Sellers remember where prices fell.
- Institutions buy at earlier accumulation zones.
- Retail traders often react based on prominent levels.
Because of this collective behavior, these levels continue to influence future price action.
📌 Conclusion
Support and resistance are the backbone of technical analysis. Once you understand how price reacts around these levels, you’ll be able to:
- Take high-probability trades
- Avoid false entries
- Manage risk better
- Identify trend reversals and breakouts
Whether you’re trading Nifty 50, Bank Nifty, stocks, or commodities, mastering support and resistance will give you a powerful edge.
✅ FAQs on Support and Resistance
1. What are support and resistance in technical analysis?
Support is a price level where buying strength prevents further decline. Resistance is a price level where selling pressure stops the price from rising. These levels help traders understand market psychology and key decision zones.
2. Why do support and resistance levels form?
They form due to repeated buying or selling interest at specific prices, institutional activity, psychological round numbers, and historical reversal points.
3. How can I identify strong support or resistance levels?
Strong levels usually have multiple touch points, occur at previous reversal zones, align with moving averages (20, 50, 200), Fibonacci levels, or trendlines, and show high volume reactions.
4. What happens when support or resistance breaks?
A breakout above resistance indicates bullish momentum, while a breakdown below support signals bearish strength. Sharp moves often follow because trapped traders exit and fresh traders enter.
5. Do support and resistance work in all timeframes?
Yes, they work across all timeframes. Higher-timeframe levels (daily, weekly) are stronger and more reliable than intraday levels.
6. Can support become resistance and vice versa?
Yes. After a breakout, old resistance often becomes new support, and after a breakdown, old support can act as new resistance. This is called role reversal.
7. Are support and resistance exact numbers or zones?
They are usually zones, not exact points. Price may react within a range of 30–50 points in indices like Nifty or Bank Nifty.
8. How do traders use support and resistance for entries?
Traders buy near support, sell near resistance, place stop-losses beyond these levels, and watch for breakout retests for safer entries.
Read More


