

Last Updated : 1st December 2025 , 6.30 pm (IST)
Introduction to Daily Prediction of Nifty 50, Nifty Bank and Nifty Financial Services
Nifty 50, Bank Nifty and Nifty Financial Services – technical analysis for 2, 3, 4, 5 December 2025 presents a clear breakdown of the short-term trend, long-term trend, key support and resistance levels, and the overall performance of the indices. Traders should closely track technical indicators such as RSI, MACD, Stochastics, and the Exponential Moving Averages (EMA 10, EMA 20, EMA 50, EMA 200) to understand market momentum and possible turning points.
The week’s market structure will also be influenced by the performance of top gainers, top losers, and the strength of leading sectors. Strong sector rotation, ETFs aligned with Nifty 50, Bank Nifty, and FINNIFTY (Nifty Finance) , and sector-specific stocks play a crucial role in identifying opportunities. This introduction provides a complete outlook combining support and resistance analysis, trend direction, sector behaviour, and indicator signals, helping traders form a clear view of the index and shortlist high-potential stocks for the week.
Topics of Discussion
NIFTY 50 Commentary – 01 December 2025
- The NIFTY 50 slipped marginally by 27.20 points, closing at 26,175.75 (-0.05%).
- Upside cushioning came from TMVP (+1.96%), BEL (+1.33%), MARUTI (+1.23%), and HCL(tech) (+1.15%).
- Pressure persisted due to weakness in Max HEALTHCARE (-1.72%), INDIGO (-1.82%), BAJAJ FINANCE (-1.58%), and SUN PHARMA (-1.32%).
- Heavyweight movement remained mixed—RELIANCE (-0.08%) aided sentiment slightly, while HDFCBANK (-0.54%), ICICIBANK (0.09%), and INFY (0.25%) kept the index subdued.
- Market breadth stayed with 23 advances, 26 declines and 1 unchanged stocks.
Gainers and Losers
Top Gainers
| Stock Name | Close (₹) | % Gain |
|---|---|---|
| TMPV | 363.80 | 1.96 |
| Bharat Electronics | 417.25 | 1.33 |
| Maruti Suzuki | 16,097.00 | 1.23 |
| HCL (tech) | 1,642.90 | 1.15 |
| Kotak Mahindra Bank | 2,147.60 | 1.09 |
Top Losers
| Stock Name | Close (₹) | % Loss |
|---|---|---|
| Max Healthcare | 1,125.40 | 3.21 |
| INDIGO | 5,794.00 | 1.82 |
| Bajaj Finance | 1,021.10 | 1.58 |
| Sun Pharma | 1,807.40 | 1.32 |
| Trent | 4,215.90 | O.81 |
Intraday Overview
- Nifty 50 Opened with a gap at 26,325.80.
- This was all day high.
- Then Hit a low of 26,124.20.
- Finally settled at 26,175.75.
- Sentiment was influenced by profit booking and caution ahead of Q2 GDP and IIP data.
Sector Gainers and Loosers
- Auto and Metal sectors absorbed much of the selling pressure.
- Weakness in Realty and Healthcare restricted broader market strength.
Top Gainers
| Sector | Close | % Gain |
|---|---|---|
| Nifty Auto | 27,933.00 | 0.78 |
| Nifty Metal | 10,353.20 | O.58 |
| Nifty Capital Market | 4,795.80 | 0.28 |
Top Loosers
| Sectors | Close | % Loss |
|---|---|---|
| Nifty Realty | 893.00 | 1.02 |
| Nifty Healthcare | 14,885.45 | 0.97 |
| Nifty Pharma | 22,887.00 | 0.48 |
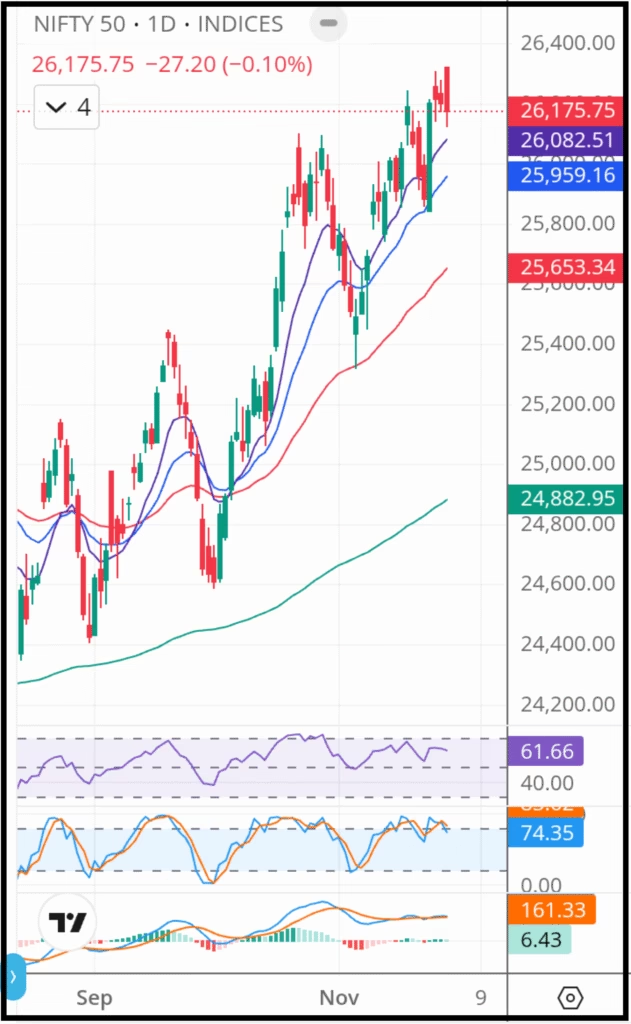
Technical Analysis of Nifty 50
Technical Interpretation
- Chart Pattern : Nifty 50 is moving inside a channel, indicating continuation of the uptrend.
- 10-Day Moving Average : The 10-day MA signals a neutral momentum.
- 20-Day Moving Average :The 20-day MA confirms bullish short term trend.
- 50-Day Moving Average : The 50-day MA shows sustained medium-term strength.
- 200-Day Moving Average : The 200-day MA maintains a strong long-term bullish structure.
- Stochastic : Stochastic indicates an overbought zone, signalling a possible minor pullback.
- RSI : RSI is hovering near overbought territory, suggesting limited upside near term.
- MACD : MACD is moving sideways, indicating momentum consolidation.
Final Combined Interpretation
- Overall prediction : Overall structure indicates strong upward momentum, but near-term pullbacks cannot be ruled out.
- Traders should hold long positions or buy with a strict stop-loss.
Daily Candlestick Chart of Nifty 50
Performance
| Nifty 50 | Performance |
|---|---|
| Open | 26,325.80 |
| High | 26,325.80 |
| Low | 26124.20 |
| Close | 26,175.75 |
| Previous Close | 26,202.95 |
| Change | -27.20 |
| % Change | -0.10 |
Resistance and Support
| Resistance | Support |
|---|---|
| Resistance 2 | 26,500 |
| Resistance 1 | 26,325 |
| Close | 26,175.75 |
| Support 1 | 26,104 |
| Support 2 | 26,000 |
Exponential Moving Averages
| Exponential | Moving | Average | (EMA) |
|---|---|---|---|
| EMA Periods | Value | Comments | Final Verdict |
| 10 Days | 26,082 | Bullish Momentum | BUY |
| 20 Days | 25,959 | Bullish Short Term Trend | BUY |
| 50 Days | 25,653 | Bullish Intermediate Term Trend | BUY |
| 200 Days | 24,720 | Bullish Long Term Trend | BUY |
Indicators
| Indicators | Inference | ||
|---|---|---|---|
| Indicators | Value | Comments | Final Verdict |
| RSI | 61.66 | Near Overbought | Neutral |
| MACD | 161.33 | Moving Sideways | Neutral |
| Histogram | 6.43 | Green Bar in Positive Territory | BUY |
| Stochastics K% | 82.02 | Overbought | SELL |
Nifty 50 Final Interpretation
| Index | Final lnterpretation |
|---|---|
| Nifty 50 | Buy with stoploss at support 1 or Buy and Hold For long Term |
BANK NIFTY Commentary – 01 December 2025
- BANK NIFTY lost 71.35 points, closing at 59,681.32 (-0.12%).
- Support emerged from Bank of Baroda (+1.98%), Kotak Mahindra Bank (+1.09%), PNB (+0.64%) and ICICI Bank (+0.09%).
- Drag came from Indusind Bank (-1.32%), Canara Bank (-0.35%), State Bank (-0.60%), and HDFC Bank (-0.54%).
- Market breadth remained perfectly balanced with 4 gainers and 7 losers.
Gainers and Loosers
Gainers
| Stock Name | Close | % Gain |
|---|---|---|
| Bank of Baroda | 295.55 | 1.98 |
| Kotak Mahindra Bank | 2,147.60 | 1.09 |
| PNB | 125.30 | 0.64 |
Loosers
| Stock Name | Close | % Loss |
|---|---|---|
| Indusind Bank | 847.15 | 1.32 |
| Canara Bank | 150.50 | 0.71 |
| State Bank of India | 973.10 | 0.60 |
Intraday Movement
- Bank Nifty Opened at 60,102.05.
- Touched a high of 60,114.30.
- Reached a low of 59,526.69.
- And finally cosed almost flat at 59,681.35.
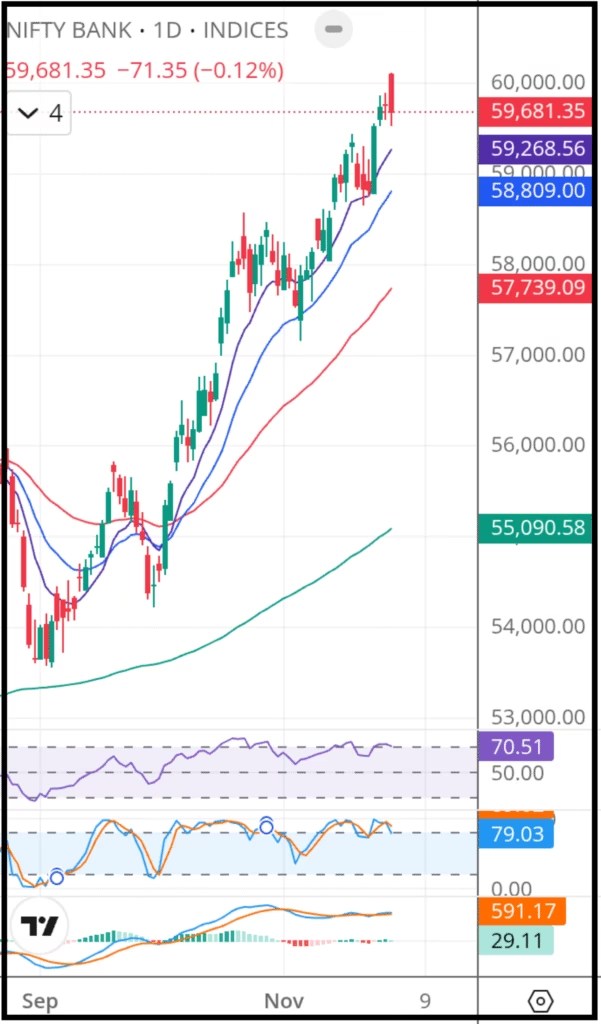
Technical Analysis of Nifty Bank
Technical Interpretation
- Chart Pattern : Nifty 50 is moving inside a channel, indicating continuation of the uptrend.
- 10-Day Moving Average : The 10-day MA signals a bullish momentum.
- 20-Day Moving Average :The 20-day MA confirms bullish short term trend.
- 50-Day Moving Average : The 50-day MA shows sustained medium-term strength.
- 200-Day Moving Average : The 200-day MA maintains a strong long-term bullish structure.
- Stochastic : Stochastic indicates an overbought zone, signalling a possible minor pullback.
- RSI : RSI is in overbought territory, suggesting limited upside near term.
- MACD : MACD is moving sideways, indicating momentum consolidation.
Final Combined Interpretation
- Overall prediction : Overall structure indicates strong upward momentum, but near-term pullbacks cannot be ruled out.
- Traders should hold long positions or buy with a strict stop-loss.
Candlestick Chart of Bank Nifty
Perfomance
| Nifty Bank | Performance |
|---|---|
| Open | 60,102.05 |
| High | 60,114.30 |
| Low | 59,527.60 |
| Close | 59,681.35 |
| Previous Close | 59,752.35 |
| Change | -71.35 |
| % Change | -0.12 |
Resistance and Support
| Resistance | Support |
|---|---|
| Resistance 2 | 60,500 |
| Resistance 1 | 60,102 |
| Close | 59,681.35 |
| Support 1 | 59,440 |
| Support 2 | 58,892 |
Exponential Moving Averages
| Exponential | Moving | Average | (EMA) |
|---|---|---|---|
| EMA Periods | Value | Comments | Final Verdict |
| 10 Days | 59,268 | Bullish Momentum | BUY |
| 20 Days | 58,809 | Bullish Short Term Trend | BUY |
| 50 Days | 57,739 | Bullish Intermediate Term Trend | BUY |
| 200 Days | 55,090 | Bullish Intermediate Term Trend | BUY |
Indicator
| Indicators | Inference | ||
|---|---|---|---|
| Indicators | Value | Comments | Final Verdict |
| RSI | 70.51 | Overbought | Sell |
| MACD | 591 | Sideways Movement | Neutral |
| MACD Histogram | 29.11 | Green Bar in positive Territory | Buy |
| Stochastics K% | 85.23 | Overbought | Sell |
Bank Nifty Final Interpretation
| Index | Final Interpretation |
|---|---|
| Nifty Bank | Buy stoploss at support 1 or Buy & Hold for Long Term |
NIFTY FINANCIAL SERVICES (FINNIFTY) Commentary – 01 December 2025
- The index slipped 75.75 points to 27,814.5 (-0.2,7%).
- Support came from Muthoot Finance (+1.78%), Kotak Mahindra Bank (+1.09%), BAJFINANCE (+0.41%), and ICICI Lombard (+1.06%).
- Downside was led by Bajaj Finance (-1.58%), REC Ltd (-0.74%), Cholamandalam Finance (-0.63%), State Bank (-0.60%), Bajaj Finserv(-0.58%).
- Market breadth was negative with 8 advances and 10 declines and 1 with no change
Gainers and Loosers
Top Gainers
| Stock Name | Close (₹) | % Gain |
|---|---|---|
| Muthoot Finance | 3,811.10 | 1.78 |
| Kotak Mahindra Bank | 2,147.6 | 1.09 |
| ICICI Lombard | 1991.40 | 1.06 |
Top Loosers
| Stock Name | Close (₹) | % Loss |
|---|---|---|
| Bajaj Finance | 1,021.10 | 1.58 |
| REC Ltd | 358.20 | 0.74 |
| Cholamandalam Finance | 1,724.90 | 0.63 |
Intraday Movement
- Finnifty Opened at 28,065.5
- High and open was same.
- Hit a low of 27,751.45.
- Last traded at 27,814.5.
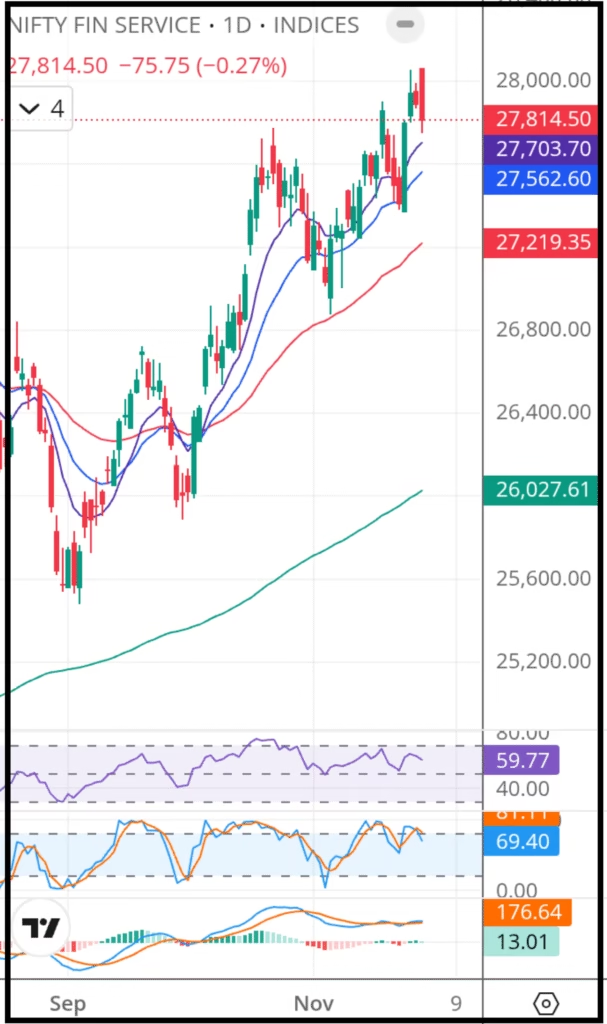
Technical Analysis of Nifty Financial Services
Technical Interpretation
- Chart Pattern : Nifty 50 is moving inside a channel, indicating continuation of the uptrend.
- 10-Day Moving Average : The 10-day MA signals a bullish momentum.
- 20-Day Moving Average :The 20-day MA confirms bullish short term trend.
- 50-Day Moving Average : The 50-day MA shows sustained medium-term strength.
- 200-Day Moving Average : The 200-day MA maintains a strong long-term bullish structure.
- Stochastic : Stochastic indicates lies near overbought zone, signalling a possible minor pullback.
- RSI : RSI is hovering in overbought territory, suggesting limited upside near term.
- MACD : MACD is moving sideways, indicating momentum consolidation.
Final Combined Interpretation
- Overall prediction : Overall structure indicates strong upward momentum, but near-term pullbacks cannot be ruled out.
- Traders should hold long positions or buy with a strict stop-loss.
Daily Candlestick Chart of FINNIFTY
Performance
| Finnifty | Performance |
|---|---|
| Open | 28,065.50 |
| High | 28,065.5 |
| Low | 27,751.45 |
| Close | 27,814.50 |
| Previous Close | 27,890.25 |
| Change | -75.75 |
| %Chsnge | -0.27 |
Resistance and Support
| Resistance | Support |
|---|---|
| Resistance 2 | 28,500 |
| Resistance 1 | 28,065 |
| Close | 27,814.50 |
| Support 1 | 27,627 |
| Support 2 | 27,370 |
Exponential Moving Averages
| Exponential | Moving | Average | (EMA) |
|---|---|---|---|
| EMA Periods | Value | Comments | Final Verdict |
| 10 Days | 27,703 | Bullish -Momentum | BUY |
| 20 Days | 27,562 | Bullish Short Term Trend | BUY |
| 50 Days | 27,219 | Bullish Intermediate Term Trend | BUY |
| 200 Days | 26,027 | Bullish Long Term Trend | BUY |
Indicators
| Indicators | Interpretation | ||
|---|---|---|---|
| Indicators | Value | Comments | Final Verdict |
| RSI | 59.77 | Near to Overbought | Neutral |
| MACD | 178.23 | Sideways Movement | Neutral |
| MACD Histogram | 13.19 | Green bar above Zero | Buy |
| Stochastics K% | 69.40 | Near to Overbought | Neutral |
Final Interpretation of Nifty Financial Services
| Index | Final Interpretation |
|---|---|
| Nifty Financial Services | Buy with stoploss at Support 1 or buy and Hold for Long Term |
Strength of Sectors
Sectorwise Strength of Nifty Indices
| Sectors | Strength |
|---|---|
| Nifty Bank | Strong |
| Nifty Financial Services | Strong |
| Nifty Capital Market | Strong |
| Nifty Metal | Strong |
| Nifty Auto | Strong |
| Nifty Healthcare | Strong |
| Nifty Oil and Gas | Above Average |
| Nifty Energy | Average |
| Nifty Pharma | Average |
| Nifty CPSE | Average |
| Nifty FMCG | Below Average |
| Nifty Realty | Weak |
| Nifty IT | Weak |
| Nifty Media | Weak |
| Market Capitalisation | Strength |
| Nifty 50 | Strong |
| Niftty Midcap 150 | Strong |
| Nifty Smallcap 250 | Below Average |
Explanation of the Sector Strength Table
The table provides a sector-wise assessment of the current strength and momentum within various Nifty indices. It helps readers quickly understand which sectors are leading the market and which ones are lagging. The strength levels—Strong, Above Average, Average, Below Average, and Weak—represent the present performance trend based on price action, volume behavior, and technical indicators.
1. Strong Sectors
These sectors are showing high momentum, strong buying interest, and positive technical structure. They are typically outperforming the broader market.
- Nifty Bank
- Nifty Financial Services
- Nifty Capital Market
- Nifty Metal
- Nifty Auto
- Nifty Healthcare
- Nifty 50
- Nifty Midcap 150
These sectors are considered market leaders and indicate where institutional money is flowing.
2. Above Average Sector
This sector is performing better than the market but not as strongly as the top sectors.
- Nifty Oil & Gas
It shows stability and improving buyer strength.
3. Average Sectors
These sectors are neither leading nor lagging. They show neutral to slightly up momentum and may need a trigger to move strongly in either direction.
- Nifty Energy
- Nifty Pharma
- Nifty CPSE
They are in a slow upward Movement phase.
4. Below Average Sectors
These sectors are showing reduced strength and may be under mild pressure.
- Nifty FMCG
- Nifty Smallcap 250
They are underperforming compared to broader indices.
5. Weak Sectors
These sectors are clearly lagging, showing weakness in trend, indicators, and relative strength.
- Nifty Realty
- Nifty IT
- Nifty Media
These sectors currently lack upward momentum and display selling pressure or lack of participation.
What This Table Tells the Reader
- Market leadership lies in Banking, Financials, Metals, Auto, Healthcare, and Midcaps.
- IT, Realty, and Media are the weakest segments and may remain volatile.
- Oil & Gas is improving and may soon move into stronger territory.
- Investors and traders can use this sector strength map to align trades with strong sectors and avoid weak ones.
Buying Stocks aligned With Strong Sector
Here is a list of stocks aligned with strong sectors
- Nifty Bank – HDFC Bank, ICICI Bank
- Nifty Financial Services – Bajaj Finance , PB Fintech Ltd
- Nifty Capital Market – BSE, Motilal Oswal Financial Services
- Nifty Metal – Tata Steel, JSW Nagar Steel, Hindalco
- Nifty Auto – Bajaj Auto, Maruti Suzuki
- Nifty Healthcare – Apollo Hospitals, Fortis Healthcare Ltd
- When selecting equities for long-term wealth creation, it is always wiser to align stock purchases with sectors that are currently demonstrating strong momentum. Sectors such as Banking, Financial Services, Capital Markets, Metals, Auto, and Healthcare are displaying robust strength, supported by positive technical setups and resilient market structure.
- Stocks like HDFC Bank, ICICI Bank, Bajaj Finance, PB Fintech, BSE, Motilal Oswal Financial Services, Tata Steel, JSW Steel, Hindalco, Bajaj Auto, Maruti Suzuki, Apollo Hospitals, and Fortis Healthcare not only belong to these outperforming sectors but also exhibit solid fundamentals, making them the kind of companies long-term investors—especially those following Warren Buffett–style value and quality investing—prefer to hold.
- With strong sectoral tailwinds and favourable chart patterns, these stocks can be considered for a minimum holding horizon of 3 to 5 years, allowing compounding and sector strength to work in your favour.
Investing in ETF
- Indian ETFs, introduced in 2002, have gained strong momentum in recent years due to their low costs, transparency, and flexibility.
- Their popularity surged as passive investing grew and many active funds struggled to beat benchmarks.
- Major institutional participation—especially EPFO’s entry after 2015—along with government support further accelerated adoption.
- Investors are also drawn to ETFs for their diversification benefits, real-time trading, and expanding category options, including sectoral, debt, gold, and thematic ETFs.
- Rising financial awareness and digital platforms have brought more retail participation, with retail investors now forming over 97% of ETF folios (as of March 2025).
Etfs With Strong Sector Strength
- Below is a list of ETFs covering the Nifty 50, Bank Nifty, FINNIFTY, and other ETFs aligned with strong sectors.
- Investors may choose to invest through a lump sum or by starting a SIP.
- However, before investing in any ETF, it is essential to review two key parameters:
- The Expense Ratio, which impacts overall returns, and
- The Tracking Error, which indicates how closely the ETF mirrors its benchmark index.
Etfs Aligned With Strong Sector
| ETF Name | Symbol | Benchmark |
|---|---|---|
| SBI-ETF NIFTY 50 | SETFNIF50 | NIFTY 50 |
| Nippon India ETF Nifty 50 BeES | NIFTYBEES | NIFTY 50 |
| Nippon India ETF Nifty Midcap 150 | MID150BEES | NIFTY MIDCAP 150 |
| UTI Nifty Bank ETF | UTIBANKETF | NIFTY BANK |
| Mirae Asset Nifty Financial Services ETF | BFSI | NIFTY FINANCE |
| ICICI Prudential Nifty Financial Services Ex-Bank ETF | FINIETF | NIFTY FINSEREXBNK |
| HDFC NIFTY Private Bank ETF | HDFCPVTBAN | NIFTY PVT BANK |
| Nippon India Nifty Auto ETF | AUTOBEES | NIFTY AUTO |
| ICICI Prudential Nifty Auto ETF | AUTOIETF | NIFTY AUTO |
| Motilal Oswal Nifty Capital Market ETF | MOCAPITAL | NIFTY CAPITAL MARKET |
| ICICI Prudential Nifty Healthcare ETF | HEALTHIETF | NIFTY HEALTHCARE |
| Aditya Birla Sun Life Nifty Healthcare ETF | HEALTHY | NIFTY HEALTHCARE |
| Axis NIFTY Healthcare ETF | AXISHCETF | NIFTY HEALTHCARE |
| Mirae Asset Nifty Metal ETF | METAL | NIFTY METAL |
| ICICI Prudential Nifty Metal ETF | METALIETF | NIFTY METAL |
Quick Recap
| Reflection 1 | Nifty 50 | Bank Nifty | Nifty Financial Services |
|---|---|---|---|
| Resistance 2 | 26,500 | 60500 | 28,500 |
| Resistance 1 | 26,325 | 60,102 | 28,065 |
| Support 1 | 26,104 | 59,440 | 27,627 |
| Support 2 | 26,000 | 58,892 | 27,370 |
| Reflection 2 | Nifty 50 | Bank Nifty | Nifty Financial Services |
| Short Term Trend | UP | UP | UP |
| Intermediate Term Trend | UP | UP | UP |
| Long Term Trend | UP | UP | UP |
| Reflection 3 | Nifty 50 | Bank Nifty | Nifty Financial Services |
| Indicators Position | Slightly Over bought | Slightly Over bought | Slightly Over bought |
| Reflection 4 | Nifty 50 | Bank Nifty | Nifty Financial Services |
| Trading Strategy for Swing Traders | Buy and keep stoploss at Support 1 | Buy and keep stoploss at Support 1 | Buy and keep stoploss at Support 1 |
| Trading Strategy for Long Term Investors | Buy and Hold | Buy and Hold | Buy and Hold |
Frequently Asked Questions (FAQ)
1. What is the current outlook for the Nifty 50?
The outlook for the Nifty 50 remains positive, with all major trends pointing upwards across short-term, medium-term, and long-term charts.
2. What are the major support levels for the Nifty 50?
Key support zones are:
26,000 (major support)
25,338 (secondary support)
3. What are the resistance levels for Nifty 50?
Important resistance levels include:
26,325
26,500 (psychological resistance)
4. What is the Nifty 50 target for December 31st?
The projected year-end target for Nifty 50 is 26,677 (if current trends continue).
5. How should traders approach the Nifty 50 now?
A suitable strategy is to consider buying on dips with a stop-loss placed just below:
26,000, or
25,857 (minor support)
6. Which sectors are showing strong performance?
The following sectors currently exhibit strong momentum:
Nifty Bank
Nifty Financial Services
Nifty Capital Market
Nifty Metal
Nifty Auto
Nifty Healthcare
7. Which sectors are weak right now?
These sectors are relatively weak at the moment:
Nifty Realty
Nifty IT
Nifty Media
8. Which stocks can be considered from the strong sectors?
Examples of fundamentally strong stocks within leading sectors:
Sector Strong Stocks
Nifty Bank – HDFC Bank, ICICI Bank
Nifty Financial Services – Bajaj Finance, PB Fintech Ltd
Nifty Capital Market – BSE, Motilal Oswal Financial Services
Nifty Metal – Tata Steel, JSW Steel, Hindalco
Nifty Auto – Bajaj Auto, Maruti Suzuki
Nifty Healthcare – Apollo Hospitals, Fortis Healthcare Ltd
9. What is the outlook for Bank Nifty?
Bank Nifty maintains a positive outlook, with all key trends showing upward momentum.
10. What is the outlook for FINNIFTY?
FINNIFTY also shows a positive trend, supported by strength in banking and financial stocks.
11. Why are Nifty Bank and Nifty Financial Services so important?
Because they contribute 36% weightage to the Nifty 50 index and form the backbone of India’s economic growth, their performance significantly influences market direction.
12. What are the major resistance levels for Bank Nifty?
Key resistance zones:
60,102
60,500
Read More


Close: 26,175.75
(Change: -27.20 points(-0.10%)