INTRODUCTION
Nifty has re-entered a strong momentum phase after a period of tight range trading. Traders should now focus on clear technical analysis of support and resistance, trend structure and indicator signals (RSI, MACD, Stochastics). Prefer stocks with relatively higher ATR for buy-on-dip and sell-on-rally trades while the index decides the next major direction. Today’s price action and the December Nifty Futures open-interest profile suggest a rapid shift from seller exhaustion to aggressive short covering.
Topics of Discussion
Introduction
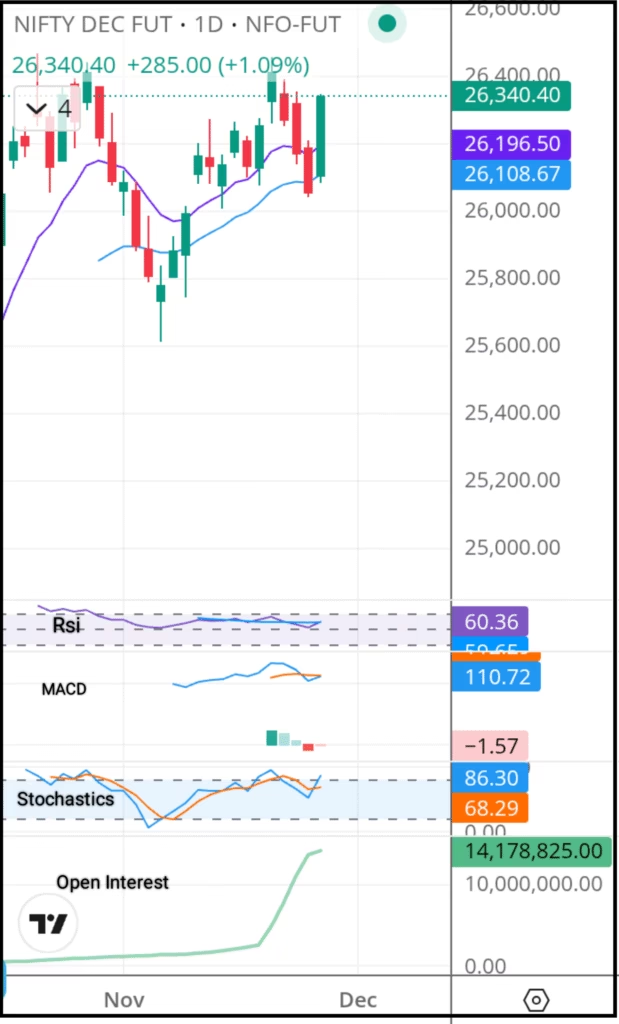
Nifty is now less than 100 points away from its all-time high of 26,277, and the index has suddenly shifted from low-volatility consolidation to a strong directional move. Over the past two weeks, the market traded inside a narrow 600–650 point band between 26,146 and 25,850. During this period, volatility dropped sharply, trader participation slowed down, and most predictions across financial websites repeated the same statements like “buy on dips,” which reduced user interest.
But the market structure changed today. Nifty has broken out of its tight intraday behavior, and the broader market has also started moving in the same direction. This article explains why this move happened, why traditional open interest signals did not work in the past two days, and what traders should expect between Nov 26–28 as Nifty approaches its third attempt to break the all-time high.
Why This Rally Happened: Understanding the Real Reason Behind the Move
For the last two sessions, the market showed a slow downward drift with rising open interest and rising volume. Any technical analysis book explains that this combination indicates fresh short build-up. If fresh shorts were actually being added, the market should have moved down aggressively.
But that did not happen. Instead of falling, the market reversed upward strongly.
This means the OI increase was not fresh shorting. It was old shorts being carried forward. Sellers who were already holding positions were defending their trades, hoping for a deeper fall. These were not strong institutional shorts. These were weak hands refusing to exit. When the market did not fall, they were trapped.
As soon as price started to rise this morning, all these trapped short sellers tried to exit at the same time — creating a wave of short covering. Short covering forces traders to buy back the same quantity they sold earlier, which creates sudden upward momentum.
This is exactly what happened in today’s price action, visible clearly in the December Nifty Futures chart.
Why Traditional OI Signals Failed
- High open interest does not always mean fresh positions.
- A slow price fall can often indicate defensive shorts, not aggressive ones.
- Volume alone cannot confirm the nature of OI.
- Weak sellers can create the illusion of bearishness.
Markets behave differently in contraction phases. During the last 10 trading sessions, Nifty volatility fell sharply. When volatility contracts, even small volumes can cause significant OI changes without representing strong directional conviction.
Thus, the OI buildup during the last two days was simply old shorts being stubborn. Not institutions placing fresh short trades.
Price Behavior Near Major Highs: Third Attempt Breakout Pattern
Nifty is now approaching the all-time high of 26,277 for the third time. In technical analysis, the third attempt has a special meaning. Markets usually test major resistances multiple times before breaking out. The first attempt shows seller strength. The second attempt tests commitment. But the third attempt often leads to a breakout because:
- Sellers become exhausted.
- Buyers get confidence from repeated rebounds.
- Short covering pressure adds to upward moves.
- Market sentiment shifts towards a new high.
Nifty has displayed all these conditions today. The market has climbed quickly from the lower end of the range towards the resistance. This is a classic setup where a breakout is more likely than rejection.
Short-term Support and Resistance Levels (Nov 26–28)
Based on the current price structure, here are the updated levels:
Resistance (Breakout Zone)
- 26,220 – 26,280 (all-time high zone)
- Break and close above 26,280 = confirmed breakout
Support Levels
- 26,080 (intraday support)
- 25,920 (trend support)
- 25,760 (major swing support)
If Nifty closes above 26,280, we can expect a quick 100–180 point move due to stops being triggered above resistance.
Indicator Analysis
Technical indicators are now supporting the upward movement.
RSI
- RSI is rising towards the 60–62 zone.
- This indicates strength without being overbought.
MACD
- MACD histogram turning positive.
- A bullish crossover is approaching.
Stochastics
- Stochastics moving upward from a mid-zone.
- Shows fresh upward momentum.
All indicators are aligned for continued strength.
Sector Performance: Broad-based Participation
The broader market is showing synchronized movement — this is not a one-sector rally. When multiple sectors move together, breakouts have a higher probability of sustaining.
Sectors currently showing strength include:
- Financials
- Information Technology
- Industrials
- Consumer and FMCG
- Hotels, travel, and tourism
This broad participation adds confidence to the upside move.
The Low Volatility Phase is Ending
Nifty spent nearly 10 sessions moving in a narrow band. Low volatility indicates indecision, reduced trader interest, and fewer opportunities. But low volatility is always followed by expansion. In today’s move, volatility expanded sharply, and price reacted to the buildup of pressure. This marks the beginning of a new movement phase.
Traders should adapt their strategies during low volatility:
- Identify stocks with strong ATR.
- Buy near support and sell on rallies within the range.
- Avoid overtrading — wait for the expansion phase.
- Switch to breakout strategies when range ends.
What Traders Should Expect Between Nov 26–28
1. A strong breakout attempt
Nifty is now close enough to the all-time high that a breakout attempt is almost guaranteed. Whether it succeeds depends on momentum at the time of testing the level.
2. Increased volatility
Today’s long-range candle signals the return of volatility. Expect wider intraday movements compared to the last two weeks.
3. Strong reactions around 26,280
Important levels like all-time highs attract heavy volume. Expect sharp movement either way.
4. If breakout fails, support at 26,080–25,920 will hold
A rejection will not immediately make the market bearish because today’s move was based on short covering.
5. If breakout succeeds, fast upmove
Stops above 26,280 will be triggered, pushing the market sharply upward.
Swing Trading and Intraday Strategy
For Swing Traders:
- Wait for a close above 26,280.
- Target 26,380 and 26,460.
- Stop-loss can be placed around 26,090.
For Intraday Traders:
- Use 26,080 as the key level for long trades.
- Buy breakouts above intraday resistance levels.
- Avoid shorting unless 25,920 is broken decisively.
Risk Factors to Monitor
Despite a strong setup, traders should watch for:
- Sudden global news shocks.
- Unusual FII selling.
- Unexpected volatility spikes.
- Failure to hold support at 25,920.
Conclusion
The last two days created the illusion of bearishness due to high open interest and slow price decline, but today’s strong rally exposed the truth: sellers were trapped, and the market had no real fresh short positions. The sharp move in December Nifty futures shows that the market is preparing for a major test of the all-time high.
Nifty has now approached the key zone of 26,220–26,280 for the third time. With broad sector participation, rising indicators, and trapped shorts being forced to exit, the probability of a breakout between Nov 26–28 is very high.
Traders should stay alert, monitor levels carefully, and prepare for volatility — because the next two sessions may set the direction for the coming weeks.
Frequently Asked Questions (FAQ)
1. Why does Nifty suddenly move up sharply after a period of low volatility?
Low volatility often indicates indecision. When traders build large short positions expecting a breakdown, any upward push forces them to cover their shorts. This creates fast, sharp rallies even without fresh buying. That’s why Nifty frequently jumps after long consolidation phases.
2. What does rising Open Interest (OI) with falling prices usually indicate?
Normally, rising OI + falling price means new short positions are being added, signalling bearishness.
But if price stops falling and suddenly rises while OI remains high, it clearly shows short covering, not new bearish strength.
3. Why did Nifty rise even though the technical pattern looked bearish?
Because the rally was driven by short-covering pressure. When many traders short at the same levels and price refuses to break down, they are forced to exit. Short covering can override traditional bearish patterns and create a temporary bullish burst.
4. Does breaking an All-Time High (ATH) guarantee further upside?
No guarantee, but probability increases.
An ATH breakout shows strong sentiment and usually attracts momentum traders. However, if the breakout happens only due to short covering and not real buying, the market may pull back after the initial surge.
5. What are the best indicators to track Nifty during a breakout attempt?
The most reliable indicators during ATH zones are:
RSI (to check strength of momentum)
MACD (trend confirmation)
Stochastics (short-term cycles)
ATR (volatility expansion)
Volume + OI (to identify real buying vs short covering)
These help confirm if the breakout is sustainable.
6. What should traders avoid during low-volatility markets?
Avoid:
Overtrading
Taking high-leverage positions
Expecting large intraday moves
Trading without stop-loss
Predicting big trend reversals inside tight ranges
Low volatility means smaller profit potential and higher false breakouts.
7. Which sectors usually move first when Nifty approaches ATH?
Sectors with strong relative strength tend to lead.
Typically these include:
Banks
IT
FMCG
Auto
Select Midcaps
If at least 2–3 of these sectors show momentum, Nifty’s ATH breakout probability increases.
8. Is it safe to buy stocks during short covering rallies?
Short covering rallies are not fundamentally strong.
They give:
Fast upside
Limited follow-through
High risk of reversal
Traders should use quick entry-exit strategies with tight stop-losses, rather than positional trades.
9. How to identify a genuine breakout above Nifty’s ATH?
A breakout is genuine when:
Price closes above ATH by a good margin
Volume expands
Indicators remain bullish
OI increases with rising price (indicating long build-up)
Pullbacks are small and supported by buyers
If these conditions are weak, the breakout might fail.
What is the ideal trading plan when Nifty is near its all-time high?
Use a structured plan:
Buy only above key resistance levels
Keep a strict stop-loss at nearest support
Avoid chasing gaps
Track sector strength
Prefer high-ATR stocks for trades
Reduce position size near ATH zones
Shift focus to index leaders during breakout attempts
This approach balances opportunity and risk effectively.
11. Why is volatility important when analysing Nifty movements?
Volatility tells you the expected size of price swings.
Low volatility → small movements, range-bound behaviour
High volatility → larger moves, better trading opportunities
When volatility compresses for many sessions, it usually leads to a strong breakout in either direction. Traders watch this closely to time entries.
12. How does ATR help in selecting stocks during low-volatility periods?
ATR (Average True Range) identifies stocks that move more than the market.
During low-volatility phases in Nifty, stocks with high ATR:
Give better intraday opportunities
Provide clearer support–resistance levels
Offer quick buy-low, sell-high moves
This is why midcaps or liquid large caps with higher ATR become ideal choices.
13. What happens to option sellers when short covering begins?
Option sellers (especially call sellers) get trapped when price moves sharply up.
Consequences include:
Rapid loss in premium
Margin pressure
Forced exit or roll-over
This adds extra buying pressure, which further accelerates the short-covering rally.
14. What signals that the short-covering rally is losing strength?
Short covering weakens when:
Price stops making higher highs
Volume drops
OI starts rising again with price struggling (indicating new shorts)
RSI forms bearish divergence
Key sectors stop participating
These are early signs that the rally may fade or reverse.
15. What should traders monitor if Nifty fails to break the all-time high?
If Nifty approaches ATH but fails to break it, watch:
Whether selling volume increases
Which sectors turn weak
If OI shifts from short covering to fresh short build-up
Support levels at 26,080 and 25,920
Any reversal candles on the daily chart
A failure at ATH can lead to a quick dip, so managing risk is crucial.
Read More