
Introduction
This week’s Nifty Smallcap 250 Prediction for 24, 25, 26, 27 & 28 November arrives not as a quiet update, but as a moment filled with anticipation — much like standing at the edge of a turning tide in the financial markets. The Nifty now sits at a decisive zone where technical signals, price action, and trader sentiment begin to align, hinting that the next strong move may already be forming beneath the surface.
Instead of simply observing charts, we are reading a language written through trendline strength, channel direction, RSI, Stochastics, EMAs, and MACD — each indicator offering its own version of the market’s message. Together, they create a layered picture of what traders may expect in the days ahead.
This week’s view does not stand alone. It draws meaning from last week’s performance and the broader six-month structure that continues to shape the Nifty Smallcap 250. Key support and resistance levels act as navigational markers, helping traders position themselves through short-term swings, medium-term strategy, and the larger trend.
Adding to this setup, we bring forward a focused selection of 5 stocks to buy this week, supported by disciplined analysis and technical validation. And as always, the spotlight remains on why the Nifty Smallcap is so important in determining the trend direction of smallcap stocks, serving as the core engine that drives India’s evolving market narrative.
Topics of Discussion
Weekly Performance and Trends
The Nifty Smallcap 250 index continued to demonstrate resilience during the week ending 21st November 2025, despite minor fluctuations in daily movements. The index opened at 17,134.15 and closed marginally lower at 16,723.75, recording a positive weekly change of 0.57%, which reflects market stability after weeks of steady gains.
Table 1 : Weekly Performance of Nifty Smallcap 250 Index
| Particulars | Value |
|---|---|
| Open | 17,134.15 |
| High | 17,226.30 |
| Low | 16,707.19 |
| Close | 16,723.75 |
| Previous Close | 17,081.45 |
| Change | -357.70 |
| Change % | -2.09 |
Nifty Smallcap 250 Trends
From a trend perspective, the Nifty Smallcap 250 market sentiment remains negative across short-term (daily), intermediate (weekly), but long-term (monthly) charta continue to show an upward trajectory. This sustained uptrend in monthly chart highlights strong participation from Smallcap stocks, with investors maintaining confidence in the segment’s growth potential in long run.
Table 2 : Snapshot of Nifty Smallcap 250 Trends
| Time frame | Chart used | Trend Direction |
|---|---|---|
| Short Term | Daily | Down |
| Intermediate Term | Weekly | Down |
| Long Term | Monthly | Up |
As the market heads into the week of 24th to 28th November 2025, the technical structure suggests ongoing strength, though selective consolidation may occur at higher levels. In this analysis, we will examine the technical summary, key patterns, and best stock opportunities within the Nifty Smallcap index to identify areas where investors can consider buying on dips or adding quality Smallcap names for medium-term gains.
A Story on Smallcap
📖 The Village of Small Warriors
The market kingdom woke up to another restless week. High on the hill, the large-cap giants stretched comfortably—admired, analyzed, and endlessly discussed. Everyone knew their strength, and everyone expected their steady march.
But far from that spotlight, in a quiet corner most traders ignored, a small village buzzed with unusual energy.
Here lived the small-cap warriors—young companies with raw potential, agile minds, and fire in their eyes. They trained relentlessly, adapting to new technologies, shifting strategies overnight, and chasing opportunities the giants were too slow to see.
Most travelers still walked past without noticing.
But the few who stopped whispered:
“This is where the next leaders will rise.”
Some of these warriors would fail.
Some would vanish in storms.
But a select few would:
✅ break out of the village
✅ grow into mid-cap knights
✅ and someday challenge the giants themselves
rewarding those wise enough to believe early.
And this week… something has changed.
The ground trembles.
Footsteps grow louder.
Charts reveal silent footprints of smart money entering the village.
Suddenly, the small-cap camp is no longer quiet.
Momentum is building.
🌱 Room to Grow
In this village, every warrior trained harder each day.
They had:
space to build
markets to conquer
innovations to create
Unlike the giants who had already reached their peaks, these small warriors were still climbing.
Their growth potential was massive.
Some of them, with enough strength and determination, would one day march into the capital and transform into:
✅ mid-cap knights
✅ or even large-cap rulers
And those who recognized them early… enjoyed extraordinary rewards.
💎 Hidden Gems
The interesting part?
Hardly anyone paid attention to them.
The big institutions, with their polished armor and strict rulebooks, rarely visited the village. Analysts wrote few stories about these young warriors. Many traders didn’t even know their names.
This lack of attention created a treasure chest of undervalued gems, waiting for someone observant enough to discover them.
For the sharp-eyed investor, this village held opportunities that the crowded city did not.
⚡ Agility and Innovation
While the giants moved slowly—held back by layers of bureaucracy—the small warriors could:
🏃♂️ change direction quickly
🛠️ adopt new technologies
🎯 seize fresh opportunities
If a new industry emerged, they were already running toward it before the giants could even turn their heads.
Their agility became their greatest weapon.
🎒 Diversifying the Journey
Travelers who added these small warriors to their traveling group discovered something powerful:
Their journey became more balanced.
Why?
Because these young warriors often behaved differently from the giants.
When the city struggled, the village sometimes thrived.
And so, including small warriors in the group provided diversification, reducing overall danger from relying on a single region of the kingdom.
🛡️ The Unexpected Invitations
Every now and then, a powerful king from the capital would notice a promising young warrior and invite them into the royal guard.
This event, known across the land as a merger or acquisition, caused celebrations in the village.
Why?
Because when a warrior was chosen…
🎉 their value skyrocketed
🎉 the village rejoiced
🎉 investors who believed early were richly rewarded
🌪️ The Risks of the Village
But the village was not without danger.
Some warriors were inexperienced.
Some lacked resources.
Some fell during storms.
The challenges included:
⚠️ higher volatility
⚠️ sudden price swings
⚠️ fewer traders to buy or sell (low liquidity)
⚠️ unproven business models
⚠️ greater chance of failure
Unlike the giants protected by walls of cash, these young companies had smaller shields and could be hurt easily by economic storms.
🔍 The Path for the Brave
Only those travelers who were:
✅ patient
✅ disciplined
✅ long-term focused
could truly benefit from this journey.
The wise elders often advised:
“If you cannot tolerate the storms, do not walk this path.”
Small-cap investing required thorough research, studying:
financials
management
business strength
competitive landscape
because with fewer storytellers and analysts around, investors needed to uncover the truth themselves.
🕰️ The Long Road
The village rewarded those who stayed for:
⏳ 7–10 years
🧭 endured volatility
🔥 believed in growth
Those who rushed or feared the first thunder often left empty-handed.
But those who stayed?
They watched young warriors grow into legends.
🎯 The Moral of the Story
Small-cap investing is not a quick treasure hunt.
It is a journey for:
✅ the patient
✅ the courageous
✅ the informed
And for those willing to walk this road, whether through:
individual small-cap stocks
or diversified mutual funds and ETFs
the potential for substantial long-term growth is real.
🌟 In One Line
While the world admires the giants on the hill, the next generation of leaders is quietly rising in the village below—waiting for someone wise enough to notice them.
Technical Analysis of Nifty Smallcap 250
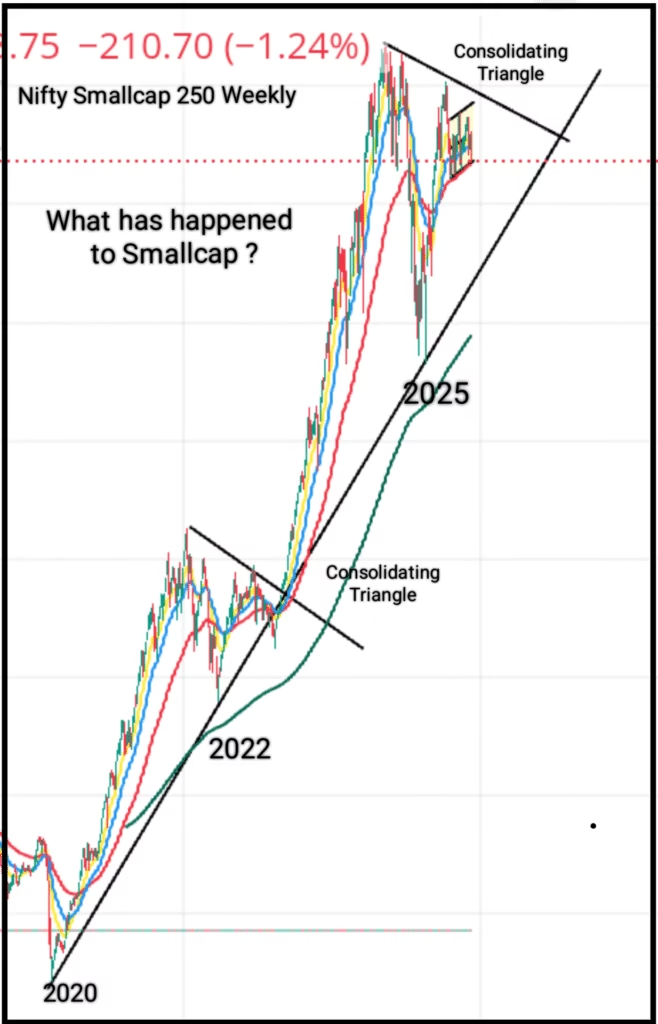
Above two Chart Source : Trading View
The above two charts is Weekly and Daily candlestick chart of the Nifty Smallcap 250 index with Exponential Moving Averages, RSI, MACD and Stochastics. Horizontal lines represents Support and Resistance. Sloping lines are Trendlines
Chart Inference:
Chart Pattern Analysis
The weekly candlestick chart of the Nifty Smallcap 250 highlights an impressive long-term performance. From 1st April 2020, when the index stood at 2,867, to the current level of 16,723, the Nifty Smallcap segment has delivered a remarkable return of approximately 483%, translating to a CAGR of around 36.64%. In practical terms, an investment made during this period would have grown nearly six-fold over 5.5 years.
Given such extraordinary growth, it is completely normal for the index to enter a consolidation phase as the market digests prior gains. The chart clearly reflects a triangular consolidation pattern in 2022, and a similar structure appears to be forming again in 2025. Unless the index breaks out decisively above the upper boundary of this triangle, the Nifty Smallcap 250 is expected to continue exhibiting range-bound movement in the near term.
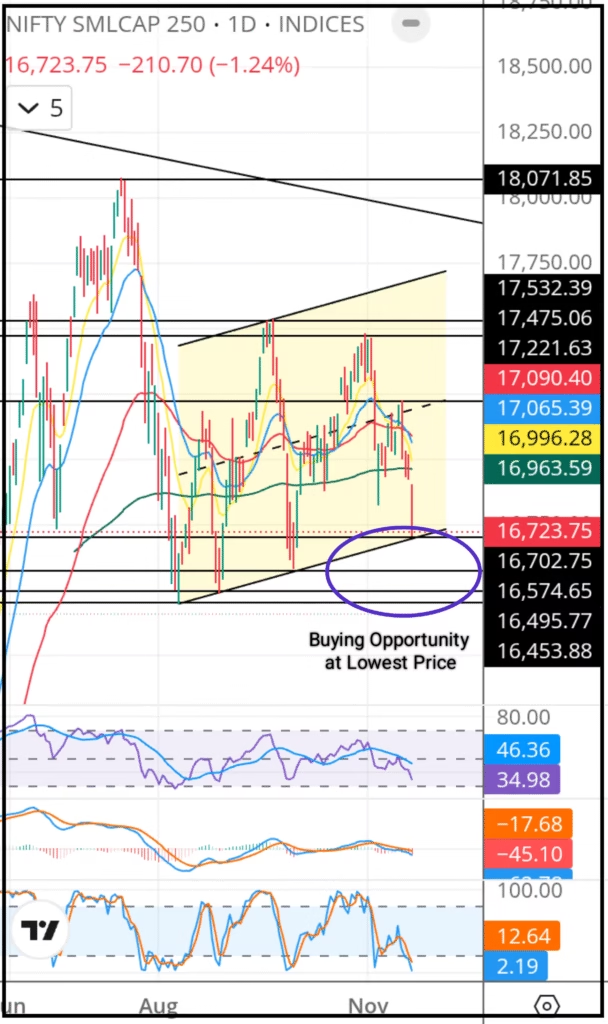
The daily candlestick chart further reinforces this view. The index is currently trading within a slightly upward-sloping channel, indicating a controlled and gradual price movement. At present, the price is positioned near the lower boundary of the channel, which coincides with three strong support zones just below it.
For investors with a higher risk appetite, this region may present a potential buying opportunity at relatively lower levels. However, caution is advised. A strict stop-loss at 16,400 should be maintained to protect against downside risk in case the support levels fail to hold.
This setup suggests a favorable risk–reward scenario, but disciplined execution remains crucial.
Support & Resistance Commentary
The Nifty Smallcap 250 is currently positioned near multiple resistance levels, marked at 17,221, 17475, and 17,750(resistance from trendline)
In the near term, the immediate resistance lies at 17,221. If the index successfully breaches 17,221 on a closing basis, we may expect a further upward move toward the next resistance zone at 17,475.
Should the momentum continue and the index manage to sustain above 17475, the next potential upside target becomes 17,750.
On the downside, the index has three key support levels placed at 16,574, 16,495, and 16,454.
If the index slips below the support at 16,574, the next likely downside test would be the zone around 16,495.
A further breakdown below 16,495 may drag the index toward the deeper support at 16,750, which is expected to act as a stronger cushion unless a major trend reversal takes place.
Table 3 : Supports And Resistances of Nifty Smallcap 250
| Support 3 | 16,453 |
| Support 2 | 16,495 |
| Support 1 | 16,574 |
| Closing | 16,723.15 |
| Resistance 1 | 17,221 |
| Resistance 2 | 17,475 |
| Resistance 3 | 17,750 |
Interpretation of EMAs (20, 50, 200)
The price is currently below the 20 EMA, indicating a short-term bearish trend.
The price is currently below the 50 EMA, indicating an intermediate-term bearish trend.
The price is currently above the 200 EMA, indicating a long-term bullish trend.
Additionally, the 20 EMA is below the 50 EMA, which confirms a bearish intermediate trend.
The 50 EMA is above the 200 EMA, which confirms a bullish long-term trend.
Table 4 : Exponential Moving Averages (EMAs)
| EMA | Value | Comments | Inference |
|---|---|---|---|
| EMA – 10 | 16,996 | Above -close & below 20 EMA & 50 EMA | SELL |
| EMA – 20 | 17,065 | Above -close & below 50 EMA | SELL |
| EMA – 50 | 17,090 | Above close and above 200 EMA | NEUTRAL |
| EMA – 200 | 13,779 | Below Close | BUY |
Interpretation of RSI (14)
The current RSI (14) value is 34.98 . Since the RSI is below the 50-level threshold, market momentum currently favors the bears.
The indicator is approaching the oversold zone, which suggests a potential short-term rebound. Traders should exercise caution and avoid initiating aggressive short positions at this stage. Instead, the preferred strategy is to buy now and sell on rallies with marginal profit and maintain a strict stoploss until the indicator confirms a clearer trend by moving above 50.
Interpretation of Stochastics
The current Stochastics (14) value is 2.19 and 12.64. Since the Stochastics is below the 50-level threshold, market momentum currently favors the bears.
The indicator is in the oversold zone, which suggests a potential short-term rebound. Traders should exercise caution and avoid initiating aggressive short positions at this stage. Instead, the preferred strategy is to buy now and sell on rallies until the indicator confirms a clearer trend and moves above 50 level.
Interpretation of MACD
The MACD value is currently -45.10, which is below the zero line. This indicates that the market is presently under the control of the bears.
Additionally, the MACD line (black) is above the signal line (red), which further confirms a bearish momentum shift. As long as this crossover remains intact, the prevailing down trend is expected to continue.
However, if the MACD line begins to converge toward the signal line, traders should be alert for a possible reversal. A confirmed crossover in the opposite direction would signal a fresh buying opportunity.
Table 5 : Indicators
| Indicator | Value | Comments | Inference |
|---|---|---|---|
| RSI | 34.98 | Approaching Oversold | NEUTRAL |
| Stochastics | 2.19 & 12.64 | Oversold | BUY |
| MACD | -45.10 | Bearish crossover in negative territory | SELL |
Technical Outlook:
Table 6 : Overall Technical Summary of Nifty Smallcap 250
| Object | Comments | Final Verdict |
|---|---|---|
| Trendlines | Slightly Up | NEUTRAL |
| EMAs | Bearish | SELL |
| RSI | Approaching Oversold Region | NEUTRAL |
| Stochastics | Oversold | BUY |
| MACD | Bearish crossover below Zero | SELL |
| Overall Outlook | Bearish but Oversold | Buy now with stoploss and sell with quick Profit Booking |
Conclusion: Overall Technical Outlook for Nifty Smallcap 250
The technical landscape for the Nifty Smallcap 250 currently presents a mixed but tactically interesting scenario. Trendlines show a slightly upward structure, yet this strength is not fully supported by momentum indicators, keeping the broader trend neutral. The EMAs and MACD both reflect bearish conditions, signaling continued weakness in the short to medium term, with sellers still maintaining control.
However, the market is also showing early signs of exhaustion on the downside. Both the RSI approaching the oversold region and Stochastics already in oversold territory suggest that selling pressure may be nearing its limit, increasing the probability of a short-term technical rebound.
Given this combination—bearish trend but oversold momentum indicators—the most practical strategy at this stage is a cautious, tactical approach. Investors and traders may consider buying selectively at current levels with a strict stop-loss, and focusing on quick profit booking as rebounds occur. Sustained strength above key resistance levels will be required before a more confident bullish outlook can emerge.
In summary, the market remains bearish but oversold, offering short-term trading opportunities, while medium-term investors should stay disciplined and risk-managed until clearer trend confirmation develops.
Smallcap Stocks to Consider for Long-Term Investment
Smallcap stocks often display higher volatility and weaker price stability compared to larger companies, particularly during uncertain market phases. However, investors should look beyond short-term price movements and focus on fundamental strength, including a company’s order book quality, revenue growth trajectory, and competitive positioning within its sector. When these factors align with favorable technical indications and strong business prospects, select smallcap companies can deliver substantial wealth creation over time.
Based on growth potential, sectoral outlook, and technical assessment, the following stocks appear attractive for long-term investment horizons. Investors with a 2 to 5-year perspective, and the ability to withstand short-term fluctuations, may consider accumulating and holding these companies for potential capital appreciation:
- Aster DM Healthcare (₹650.20)
- Krishna Institute of Medical Sciences (₹670.10)
- Kalpataru Projects (₹1,229.40)
- Brigade Enterprises (₹898.70)
- Minda Corporation (₹595.20)
These businesses demonstrate strong fundamentals and promising growth drivers, making them suitable candidates for long-term portfolios, provided investors maintain discipline and a strategic holding approach.
📌 “Part of the Nifty Weekly Prediction Package – Click below to explore all predictions”
Read More


Weekly Close: 16,723.75
(Change: -357.70 points(-2.09%)