
Introduction to Nifty 50 weekly Prediction Series
In this week’s Nifty 50 Prediction for 24, 25, 26, 27 & 28 November, we break down everything a trader needs — from detailed technical analysis to clear support and resistance levels, short-term momentum shifts, medium-term structure, and the long-term trend of the index. This section also covers MACD, RSI, Stochastics, trendline strength, channel direction, and how the previous week and last six-month performance shape the market’s next move. You’ll also find our list of 9 stocks to buy this week, along with a data-backed explanation of why the Nifty 50 is unlikely to fall sharply given India’s strong economic landscape.
📌 Please Note : All data, charts, and commentary on this page are updated daily after the market closes, ensuring traders receive the latest insights and can plan their next trading day with confidence.
Topics of Discussion
A Quick Recap of Recent Market Performance
The Nifty 50 started its decline from the record high of 26,277 on 27 September 2024 and continued sliding until 7 April 2025, marking a bottom at 22,743. This drop of 4,334 points represents a 16.49% correction.
From 8 April 2025 onward, the index shifted gears and entered a strong recovery phase, climbing 4,134 points — an impressive 99% retracement of the previous fall, translating to a gain of roughly 19%.
Despite this sharp rebound, the broader market has not moved in sync with the Nifty 50. Many sectors have lagged behind, and even the Nifty Smallcap 250 has struggled to match the benchmark’s momentum. This indicates that the current upswing is selective rather than broad-based.
Therefore, relying only on the Nifty 50’s trend does not provide a complete picture for traders. Consistent decision-making requires understanding which sectors are outperforming and which are losing strength. In summary, effective trading depends on clear insights into sector-wise market behaviour rather than just index-level movements.
Weekly Performance and Trends
The Nifty 50 index continued to demonstrate resilience during the week ending 21st November 2025, despite minor fluctuations in daily movements. The index opened at 25,948.2 and closed marginally higher at 26,068.14, recording a positive weekly change of +0.61%, which reflects market stability after weeks of steady gains.
From a trend perspective, the Nifty 50 market sentiment remains positive across all time frames — short-term (daily), intermediate (weekly), and long-term (monthly) charts continue to show an upward trajectory. This sustained uptrend highlights strong participation from bank stocks, with investors maintaining confidence in the segment’s growth potential.
As the market heads into the week of 24th to 28th November 2025, the technical structure suggests ongoing strength, though selective consolidation may occur at higher levels. In this analysis, we will examine the technical summary, key patterns, and best stock opportunities within the Nifty index to identify areas where investors can consider buying on dips or adding quality Nifty 50 names for medium-term gains.
Table 1 : Weekly Performance of Nifty 50 Index
| Particulars | Value |
|---|---|
| Open | 25,948.20 |
| High | 26,246.65 |
| Low | 25,856.20 |
| Close | 26,068.15 |
| Previous Close | 25,910.05 |
| Gain | +158.10 |
| Gain(%) | +0.61 |
Table 2 : Snapshot of Nifty 50 Trends
| Time Frame | Chart Used | Trend Direction |
|---|---|---|
| Short Term | Daily | UP |
| Intermediate Term | Weekly | UP |
| Long Term | Monthy | UP |
Trend Direction Based on Trading System Indicators
| Trading System Indicator | Daily Chart | Weekly Chart | Monthy Chart |
|---|---|---|---|
| Elder Impulse System | NEUTRAL | UP | UP |
| Helkin Ashi | NEUTRAL | UP | UP |
| Parabolic SAR | UP | UP | UP |
| Ichimoku Cloud | UP | UP | UP |
| Super Trend | UP | UP | UP |
For details on how to read these indicators, refer to the below mentioned article

5 Advanced Technicals & Market Signals: Elder Impulse, Ichimoku, SAR, Heikin Ashi & Supertrend Explained
Nifty Sector Strength
Nifty sector indices provide a deeper layer of market understanding by highlighting how individual sectors are performing relative to the broader index. Knowing the direction of the trend alone is not enough to make informed trading decisions—two sectors may both be trending upward, yet their momentum, participation, and internal strength can vary significantly. Sector-wise strength helps identify where institutional money is flowing, which sectors are driving the index, and which ones are lagging or losing momentum. The table below offers a clear snapshot of sector strength, helping traders and investors focus on robust sectors while avoiding weak or unstable ones. This approach not only improves entry and exit decisions but also enhances overall portfolio positioning by aligning trades with the strongest market segments.
Sectorwise Strength of Nifty Indices
| Sectors | Strength |
|---|---|
| Nifty Bank | Strong |
| Nifty Financial Services | Strong |
| Nifty Capital Market | Strong |
| Nifty Metal | Strong |
| Nifty Auto | Strong |
| Nifty Healthcare | Strong |
| Nifty Oil and Gas | Above Average |
| Nifty Energy | Average |
| Nifty Pharma | Average |
| Nifty CPSE | Average |
| Nifty FMCG | Below Average |
| Nifty Realty | Weak |
| Nifty IT | Weak |
| Nifty Media | Weak |
| Market Capitalisation | Strength |
| Nifty 50 | Strong |
| Niftty Midcap 150 | Strong |
| Nifty Smallcap 250 | Below Average |
For Details on Sector Strength Prediction refer to the article below

Nifty Sector Prediction for 24, 25, 26, 27 & 28 November with Trends Performance and Sector Strength
Technical Analysis of Nifty 50
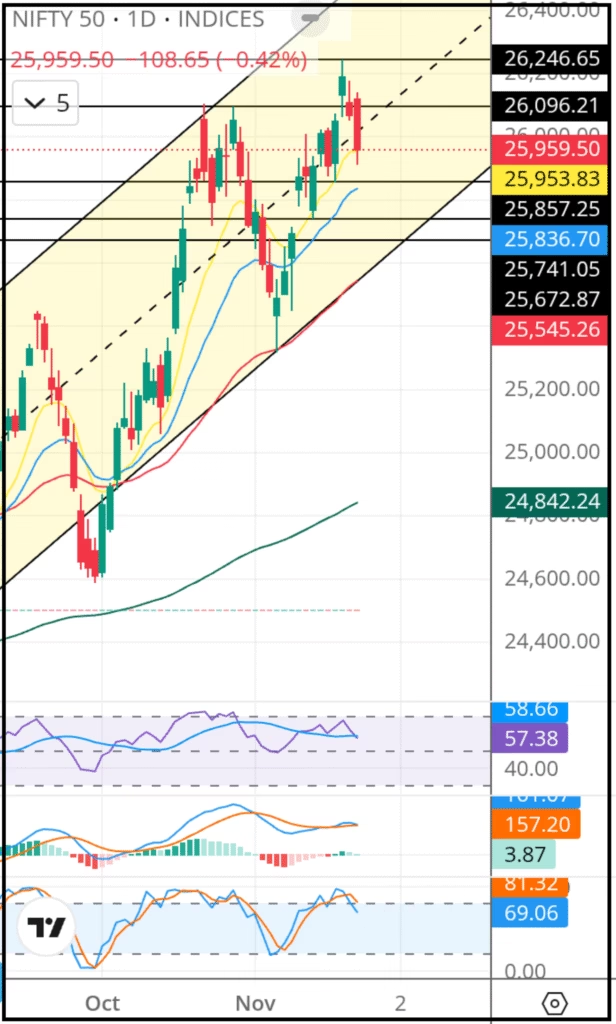
Chart Source : Trading View – Last Updated : Monday 24th November 2025
Chart Description
Candlestick Chart
This is a daily candlestick chart of the Nifty 50 index. Details and how to read the chart is shown in the article below

Nifty 50 : Prediction for 10th to 14th November 2025 with Factors Affecting it’s Performance
Nifty 50 weekly analysis: After breaking the 25,686 resistance and crossing 26,000, the index faced a short-term pullback to 25,318. While the intermediate and long-term trends remain bullish,...
Read More →Chart Inference:
Chart Pattern
The Chart shows that the prices are moving between a fixed uptrending channel.
Nifty 50 is continuously creating higher highs and higher lows since 1st October 2025.
Support & Resistance Commentary
The Nifty 50 is currently positioned near multiple resistance levels, marked at 26,000, 26,096, and 26,246-26277.
In the near term, the immediate resistance lies at 26,000.
If the index successfully breaches 26,000 on a closing basis, we may expect a further upward move toward the next resistance zone at 26,096.
Should the momentum continue and the index manage to sustain above 26,096, the next potential upside target becomes 26,246-26,277.
On the downside, the index has three key support levels placed at 25,857, 26,741 and 25,672 .
If the index slips below the support at 25,857, the next likely downside test would be the zone around 26,741.
A further breakdown below 26,741 may drag the index toward the deeper support at 25,672, which is expected to act as a stronger cushion unless a major trend reversal takes place.
Table 3 : Supports & Resistances for Nifty 50
Last updated : Monday, 24th November 2025
| Support 3 | 25,672 |
|---|---|
| Support 2 | 25,741 |
| Support 1 | 25,857 |
| Close | 25,959.59 |
| Resistance 1 | 26,000 |
| Resistance 2 | 26,096 |
| Resistance 3 | 26,046-26,077 |
Interpretation of EMAs (20, 50, 200)
The price is currently above the 20 EMA, indicating a short-term bullish trend.
The price is currently above the 50 EMA, indicating an intermediate-term Bullish trend.
The price is currently above the 200 EMA, indicating a long-term bullish trend.
Additionally, the 20 EMA is above the 50 EMA, which confirms a bullish intermediate trend.
The 50 EMA is above the 200 EMA, which confirms a bullish long-term trend.
Table 4 : Exponential Moving Average(EMA) Analysis & View
Last updated, Monday 24th November 2025
| EMA Period | Value | Comments | Inference |
|---|---|---|---|
| 10 Days | 25,953.83 | Below Closing & EMA(10)>EMA(20) | BUY |
| 20 Days | 25,836.70 | Below Closing & EMA(20)>EMA(50) | BUY |
| 50 Days | 25,545.26 | Below Closing & EMA(50)>EMA(200) | BUY |
| 200 Days | 24,842.24 | Below Closing & EMA(50)>EMA(200) | BUY |
Interpretation of RSI (14)
The current RSI (14) value is 63.02 . Since the RSI is above the 50-level threshold, market momentum currently favors the bulls.
The indicator is approaching the overbought zone, which suggests a potential short-term pullback.
Traders should exercise caution and avoid initiating aggressive short positions at this stage.
Instead, the preferred strategy is to buy on dips until the indicator cools off and confirms a clearer trend direction.
Interpretation of Stochastics
The current Stochastics (14) value is 83.47. Since the Stochastics is above the 50-level threshold, market momentum currently favors the bulls.
The indicator is in the overbought zone, which suggests a potential short-term pullback.
Traders should exercise caution and avoid initiating aggressive short positions at this stage.
Instead, the preferred strategy is to buy on dips until the indicator confirms a clearer trend.
Interpretation of MACD
The MACD value is currently 156, which is above the zero line. This indicates that the market is presently under the control of the bulls .
Additionally, the MACD line (black) is above the signal line (red), which further confirms a bullish momentum shift. As long as this crossover remains intact, the prevailing trend is expected to continue.
However, if the MACD line begins to converge toward the signal line, traders should be alert for a possible reversal or loss of momentum. A confirmed crossover in the opposite direction would signal a fresh buying opportunity.
Table 5 : Oscillator's Views
Last updated : Monday 24th November 2025
| Oscillator | Value | Comments | Inference |
|---|---|---|---|
| RSI | 57.38 | Returning from Overbought | SELL |
| Stochastics | 81 | In Overbought Region | SELL |
| MACD | 157.2 | Bullish Crossover | BUY |
Technical Outlook:
Overall technical bias and expected price action
Table 6 : Overall Technical Summary
Last updated on Monday 24th November 2025
| Indicator | Comments | Final Verdict |
|---|---|---|
| Trend lines | Uptrending Channel | BUY |
| EMAs | Below Closing | BUY |
| RSI | Near Overbought | SELL |
| Stochastics | Overbought | SELL |
| MACD | Bullish Crossover | BUY |
| Overall View | Short Correction before upmove | Buy in every Small Dip |
Conclusion
The technical indicators present a mixed but overall constructive outlook for the market. While momentum oscillators like RSI and Stochastics signal short-term overbought conditions—indicating the possibility of a mild correction—the broader trend remains firmly bullish. Key trend-based indicators such as the trendline, price channel, closing behavior, and MACD bullish crossover all point toward sustained upward momentum.
In summary, any short-term dip should be viewed as a buying opportunity, as the underlying trend continues to favor the bulls.
Stocks to Buy This Week
Given the sustained resilience in Nifty 50 the following stocks have been selected for the upcoming week.
- HDFC Bank
- Axis Bank
- Kotak Mahindra Bank
- ICICI Bank
- State Bank of India
- Bajaj Auto
- Tata Steel
- JSW Steel
- Hindalco Inds
These stocks represent fundamentally strong, well-managed businesses trading at sensible valuations — the kind of opportunities that align with the long-term investing philosophies of Warren Buffett and Charlie Munger. Each company has the potential to deliver steady compounding over time. Current technical signals, combined with solid fundamentals, further reinforce the constructive outlook for these selections.
.
Table 7 : Stocks To Buy this Week
| Stock Name | Buying Price (₹) | Stoploss Price (₹) | Expected Price (₹) |
|---|---|---|---|
| HDFC Bank | 998 | 980 | 1068 |
| ICICI Bank | 1369 | 1340 | 1500 |
| Kotak Mahindra Bank | 2087 | 2045 | 2274 |
| Axis Bank | 1276 | 1250 | 1350 |
| State Bank of India | 973 | 953 | 1050 |
| Bajaj Auto | 8892 | 8700 | 9500 |
| JSW Steel | 1140 | 1117 | 1217 |
| Tata Steel | 168 | 163 | 185 |
| Hindalco Inds | 777 | 761 | 839 |
| Mahendra & Mahendra | 3750 | 3675 | 4087 |
Why the Outlook for Nifty 50 Remains Positive for the Long Term
Imagine India in 2025—not just as an economy on the rise, but as a country standing confidently at the intersection of ambition, stability, and unstoppable momentum. The skyline is changing, cities are expanding, and millions of new consumers are stepping into better jobs, better incomes, and better lifestyles. This transformation is not just visible on the streets—it is reflected every single day on the Nifty 50 chart.
With India now recognised as the world’s fastest-growing major economy and the fourth-largest by nominal GDP, the market isn’t just moving upward; it is growing on the strength of a nation that is rewriting its own growth story.
A Nation Setting the Stage for Market Growth
In boardrooms, small shops, tech offices, and government planning rooms, a quiet but powerful confidence is building. The numbers tell their own story:
GDP is growing between 6.2% and 6.8%
Inflation is controlled at just 1.55%
FDI inflows have crossed USD 81 billion
Unemployment remains low at 3.2%
Forex reserves stand tall at nearly USD 700 billion
These are not random figures. They are signals—clear signs that India is operating on a strong and steady foundation. And when a country stands firm, its markets rarely crumble.
How This Translates Into Nifty’s Long-Term Strength
As you look deeper into the Nifty 50, you begin to see that its long-term positive outlook is not based on speculation. It is driven by real activities happening across the economy.
The Beat of Domestic Consumption
Every month, millions of Indians spend more—on food, technology, services, banking, travel, retail. This growing consumer base acts like a constant heartbeat, supplying fresh energy to Nifty companies.
A strong consumer means strong earnings.
Strong earnings mean strong markets.
A Government Building the Future
Highways stretch forward, bridges rise, metros expand, and renewable energy plants hum with power.
Every project, every investment, every new policy adds muscle to sectors like infrastructure, banking, construction, capital goods, and energy—key components of the Nifty 50.
The message is simple:
Capex today is market strength tomorrow.
A Dual Engine: Services + Manufacturing
India’s services sector continues to lead from the front, while manufacturing is stepping into a bigger role with PLI schemes, global supply chain shifts, and export competitiveness.
This combination ensures that the corporate earnings pipeline for Nifty companies stays healthy for years, not months.
Fortress of Forex Reserves
With nearly USD 700 billion in reserves, India has built a financial shield that most developing economies can only dream of.
This cushion keeps the rupee stable, encourages foreign investors, and limits panic during global market shocks.
Why Nifty’s Long-Term Uptrend Is Hard to Break
When you put all these pieces together—the thriving consumer base, rising incomes, infrastructure boom, solid reserves, and strong macro indicators—you begin to notice something deeper:
Corrections may come.
Global uncertainty may shake the markets.
Oil prices may rise.
US data may cause temporary fear.
But India’s foundation is so strong, and its growth journey so solid, that every fall eventually becomes an opportunity. Every pullback becomes a stepping stone.
And every consolidation sets the stage for the next climb.
The long-term uptrend is not luck.
It is the natural outcome of a nation that is compounding its strengths year after year.
A Story Still Being Written
Yes, challenges exist—global trade tensions, crude oil fluctuations, and economic cooling in advanced economies. But India is no longer the fragile economy it once was.
It has transformed into one of the world’s most resilient markets, where domestic demand acts as a buffer and long-term reforms keep growth alive.
That’s why the Nifty 50’s future continues to look bright—not because the charts say so, but because India itself is in the middle of a long-term growth story that is far from over.
And as long as India keeps rising, the Nifty 50 will continue to rise with it.
Frequently Asked Questions (FAQ)
Q1. How is the Nifty 50 performing at the moment?
The Nifty 50 is showing strength across all timeframes. Short-term, medium-term, and long-term trends are all pointing upward, confirming a strong bullish environment.
Q2. What are the key support levels for the Nifty 50?
The important support zones are 26,000, 25,857, and 25,741, which may act as strong buying levels if the market dips.
Q3. What are the major resistance levels for the Nifty 50?
The key resistance levels to track are 26,246, 26,277, and 26,500. A breakout above these may lead to further upside.
Q4. What do the latest chart patterns indicate for the Nifty 50?
Chart analysis shows the Nifty is moving inside a clear upward channel, indicating a controlled and steady uptrend.
Q5. What are RSI and Stochastics indicating right now?
Both RSI and Stochastics are in overbought zones, signalling that a short-term correction or consolidation may occur before the next rally.
Q6. What does the MACD reveal about Nifty’s momentum?
The MACD has given a bullish crossover, suggesting strong upward momentum and increasing buying pressure.
Q7. What factors influence the performance of the Nifty 50?
Nifty’s movement is driven by India’s economic growth, corporate earnings, global sentiment, FII/DII flows, inflation trends, crude oil prices, and government policy.
Q8. Which stocks are recommended to buy this week and what returns can be expected?
The preferred stocks for this week are:HDFC Bank, Axis Bank, Kotak Mahindra Bank, ICICI Bank, State Bank of India, Bajaj Auto, Tata Steel, JSW Steel, and Hindalco Industries.These stocks have a potential to deliver 10–20% returns depending on market conditions.
Q9. Why does the long-term outlook for the Nifty 50 remain positive?
India’s strong economic foundation, rising domestic participation, and consistent earnings growth support a positively structured long-term outlook for the index.
Q10. What is India’s GDP growth range at the moment?
India’s GDP growth is estimated between 6.2% and 6.8%, indicating a healthy and sustainable growth trajectory.
📌 “Part of the Nifty Weekly Prediction Package – Click below to explore all predictions”

Read More


Weekly Close: 26,068.15
(Change: +158.10 points(-0.61%)