
Introduction
Past performance data of Nifty sectors highlights how much each index has gained over time, but it doesn’t necessarily reflect which sectors are currently strong or weak in the ongoing market environment. Relying only on price movement can be deceptive — a sector that delivered strong gains earlier may now be nearing resistance, while another with modest recent returns could actually be forming a solid base for a fresh upward move.
This is where technical analysis plays a crucial role. By examining support-resistance zones, trend behaviour, and momentum conditions, we can pinpoint which sectors hold the potential to outperform in the coming sessions.
This week’s Nifty Sectorwise Prediction for 24, 25 , 26, 27, 28 November 2025 follows this approach, offering a more insightful picture of sector strength and highlighting possible rotation setups across the broader market.
Topics of Discussion
14 Sectors to Discuss
Although the Indian stock market consists of more than 14 sectors, this analysis focuses on 14 key sectors that collectively represent the broader movement of the Nifty 50 index. Since the Banking and Financial Services segments together contribute over 36% to the Nifty 50‘s total weight, they naturally hold the highest influence and will be addressed first.
List of 14 Sectors Covered:
- Nifty Bank
- Nifty Financial Services
- Nifty Auto
- Nifty Pharma
- Nifty Healthcare
- Nifty IT
- Nifty FMCG
- Nifty Oil and Gas
- Nifty Energy
- Nifty CPSE
- Nifty Metal
- Nifty Realty
- Nifty Media
- Nifty Capital Market
Technical Strength of Nifty Sectors
The primary objective of this section is to identify the relative technical strength of each sector. Unlike individual stock analysis, sector-level support and resistance zones are not the core focus, with the exception of the Banking sector due to its dominant market influence.
This assessment is based on weekly charts, which provide a clearer understanding of intermediate trend strength and help traders make more informed decisions. By classifying sectors into three categories, traders can quickly identify potential opportunities and focus on sectors that currently exhibit favorable momentum.
The categories are:
- Strong Performers
- Average Performers
- Poor Performers
Strong Performers
Nifty Bank
This sector is discussed separately in detail in the article below. However, it is important to highlight that the Banking sector continues to remain one of the strongest and most influential segments, providing substantial support to the broader market trend.

Bank Nifty Prediction for 24, 25, 26, 27 & 28 November with Resistance, Trends and Top Bank Stocks
Nifty Financial Services
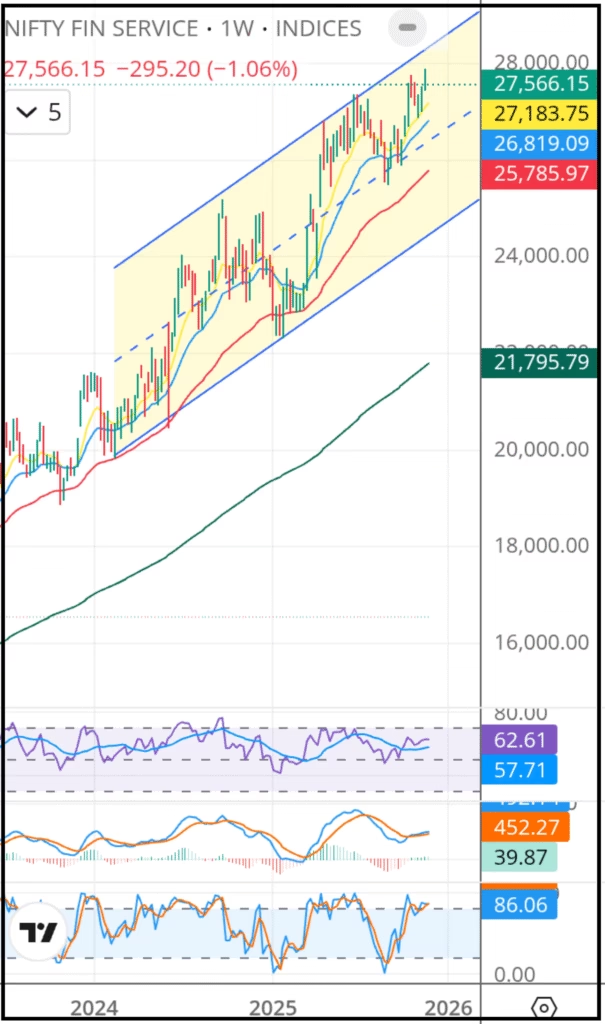
The weekly chart indicates that Nifty Financial Services has been oscillating within an upward channel for nearly two years. Although there have been periodic pullbacks, the recoveries have been swift, allowing the index to maintain its bullish structure by forming consistent higher highs and higher lows.
Currently, the index is positioned in a slightly overbought zone.
Key observations:
Price action remains above all major moving averages
Ideal bullish alignment:
10-week EMA > 20-week EMA > 50-week EMA > 200-week EMA
This is a classic configuration of a strong bull market trend
RSI around 62, approaching the overbought territory
Stochastics near 86, indicating possible short-term exhaustion
Given these conditions, there is a possibility of a short-term pullback, while the broader trend continues to remain positive and intact.
Nifty Capital Market
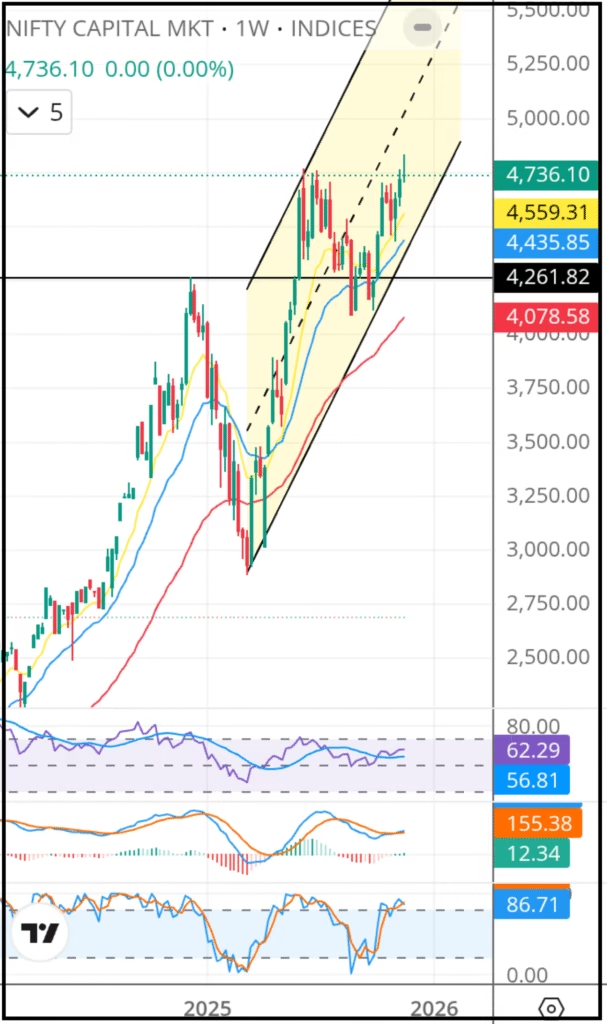
The weekly chart indicates that Nifty Capital Market has been trending within an upward channel for the past year. While the index experienced brief pullbacks, the recovery was swift, allowing the bullish structure to remain intact and enabling the formation of continuous higher highs and higher lows. Recently, the sector registered a breakout above the key resistance level at 4,261, further strengthening the bullish outlook.
At present, the index is positioned in a slightly overbought zone.
Key Technical Highlights:
Price remains above all major moving averages
Ideal bullish alignment:
10-week EMA > 20-week EMA > 50-week EMA > 200-week EMA
This reflects a strong bull market setup
RSI around 62, nearing overbought territory
Stochastics at 87, suggesting short-term exhaustion
MACD shows a bullish crossover, indicating that the uptrend is likely to resume after a minor correction
Overall, the sector maintains a strong technical structure, with the possibility of a brief pullback before continuation of the upward trend.
Nifty Metal
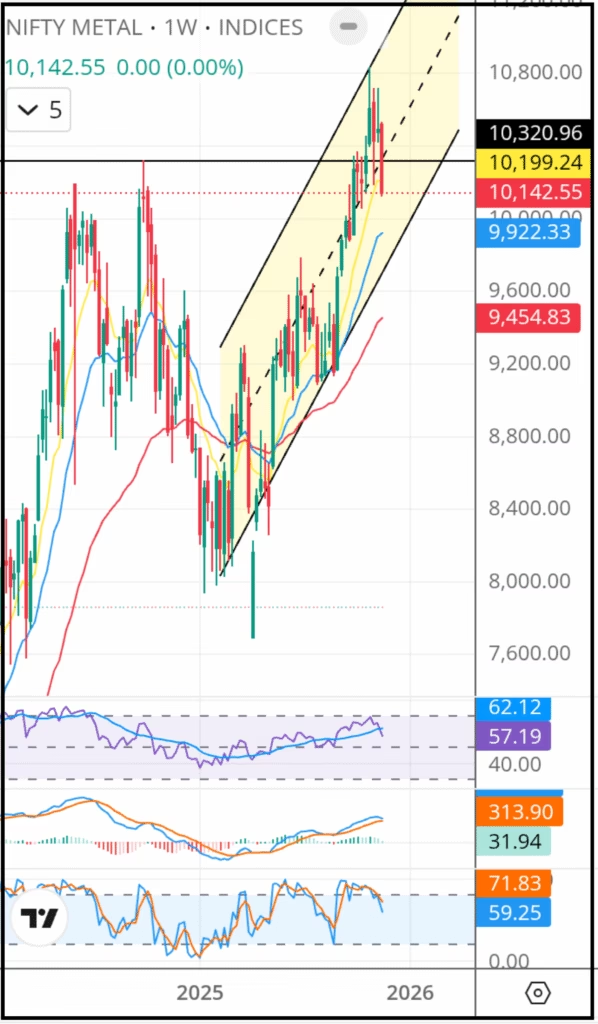
The weekly chart shows that Nifty Metal has been moving within an uptrending channel for the past year. Despite periodic pullbacks, the sector recovered quickly, preserving the bullish pattern of higher highs and higher lows. A recent breakout above 10,320 confirms continued strength in the sector.
Currently, the index remains in a slightly overbought region.
Technical Overview:
Price trading above all major moving averages
Bullish EMA alignment:
10-week EMA > 20-week EMA > 50-week EMA > 200-week EMA
RSI near 62, signaling overbought conditions
Stochastics around 72, indicating limited upside in the short term
MACD is converging toward a bearish crossover, suggesting the possibility of a temporary correction before the trend resumes
The broader trend remains positive, with any pullback expected to be more of a consolidation phase within the ongoing uptrend.
Nifty Auto
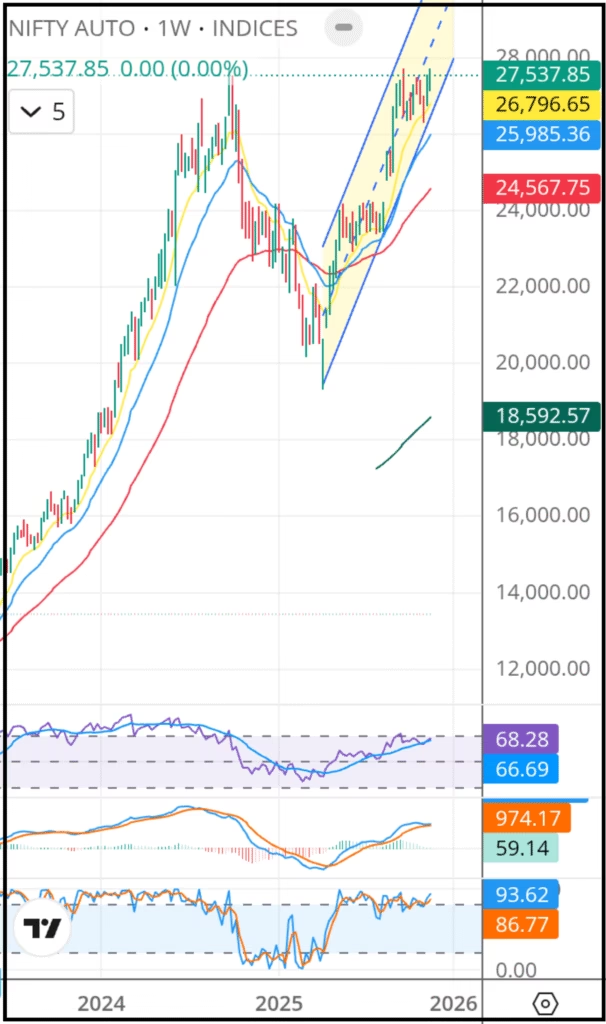
The weekly chart reflects that Nifty Auto has been consistently moving within an uptrending channel for the past year. Pullbacks were followed by quick recoveries, helping maintain a strong bullish structure supported by higher highs and higher lows. The sector recently broke above the 27,537 resistance level, adding further momentum.
Currently, the index is in the slightly overbought region.
Technical signals include:
Price above major moving averages
Strong EMA alignment:
10-week EMA > 20-week EMA > 50-week EMA > 200-week EMA
confirming a robust bull trend
RSI around 68, approaching overbought territory
Stochastics at 93, indicating extreme overbought levels
MACD converging toward a bearish crossover, implying a potential short-term correction
Overall, the trend remains strong, with a likely consolidation or pullback before continuation of the upward trajectory.
Nifty Healthcare
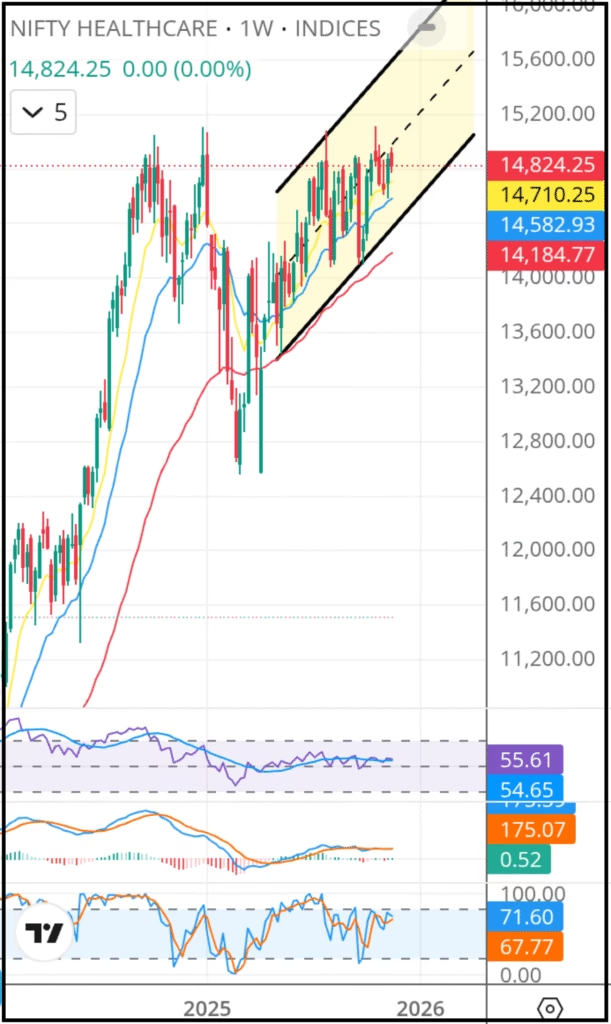
The weekly chart suggests that Nifty Healthcare has also been moving within an uptrending channel for the past year. Pullbacks were limited and followed by steady recoveries, helping the sector maintain the sequence of higher highs and higher lows.
Currently, the index lies in a slightly overbought zone, but the momentum remains constructive.
Key observations:
Price trading above all key moving averages
Bullish EMA structure:
10-week EMA > 20-week EMA > 50-week EMA > 200-week EMA
RSI at 55, indicating a neutral-to-positive momentum zone
Stochastics at 71, supporting the possibility of continued upside
MACD moving flat, suggesting a range-bound or sideways movement in the near term
The sector may continue its upward bias, although the momentum could remain gradual or consolidated.
Average Performers
Nifty Oil and Gas
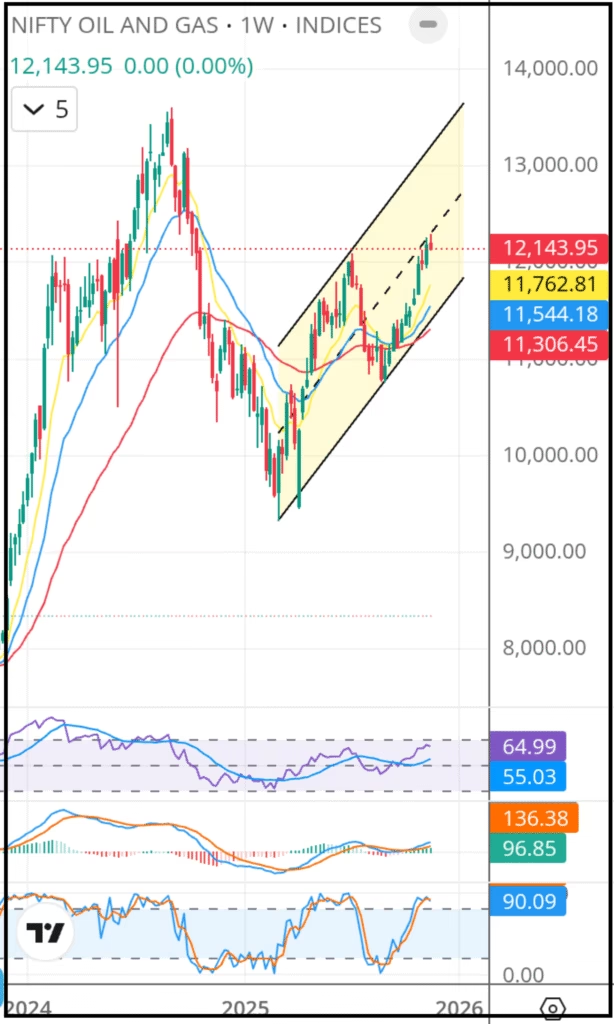
The weekly chart shows that Nifty Oil and Gas continues to move within an uptrending channel over the past year. Although the sector has experienced pullbacks similar to the stronger performers, the recovery has been comparatively slower. Even so, the uptrend remains intact, supported by the formation of higher highs and higher lows.
Currently, the index is positioned in a slightly overbought region.
Key Technical Highlights:
Price trading above all major moving averages
Bullish EMA alignment:
10-week EMA > 20-week EMA > 50-week EMA > 200-week EMA
RSI around 65, indicating neutral-to-positive momentum
Stochastics at 90, suggesting short-term overbought conditions
MACD showing a bullish crossover, indicating the potential for a strong rally after a brief correction
Overall, the sector maintains a positive structure, with the possibility of continued upside following consolidation.
Nifty Pharma
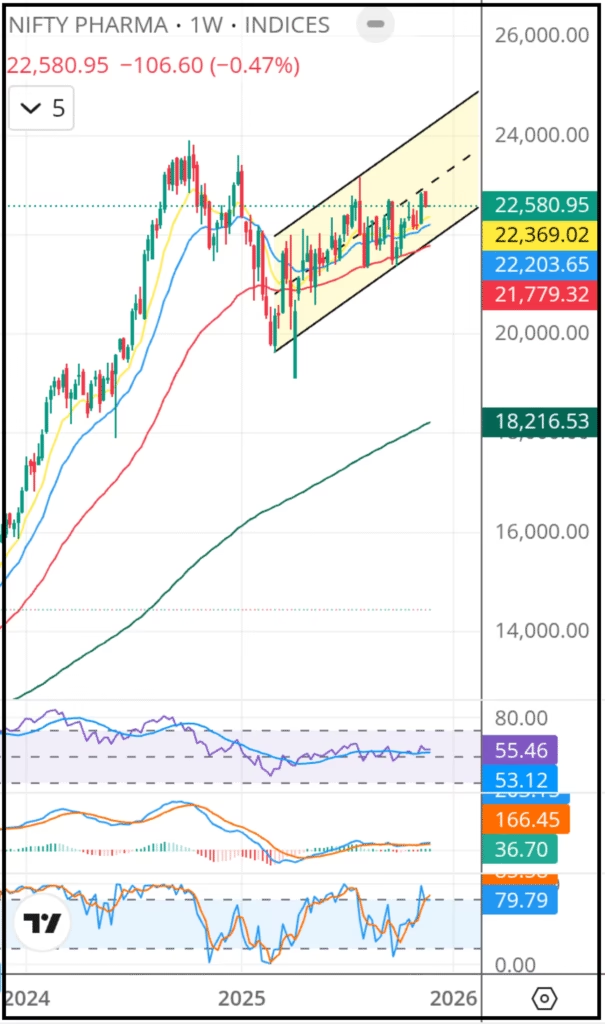
The weekly chart suggests that Nifty Pharma has also been moving within an uptrending channel for the past year. While recoveries after pullbacks were slower compared to strong-performing sectors, they were sufficient to maintain the bullish pattern of continuous higher highs and higher lows.
At present, the index remains in a slightly overbought zone.
Technical observations:
Price above major moving averages
Bullish EMA setup:
10-week EMA > 20-week EMA > 50-week EMA > 200-week EMA
RSI near 56, indicating neutral momentum
Stochastics around 80, supporting the possibility of continued upside
MACD showing a flattish trend, pointing to potential sideways or range-bound movement
The sector may continue its gradual upward movement, but momentum could remain moderate.
Nifty CPSE
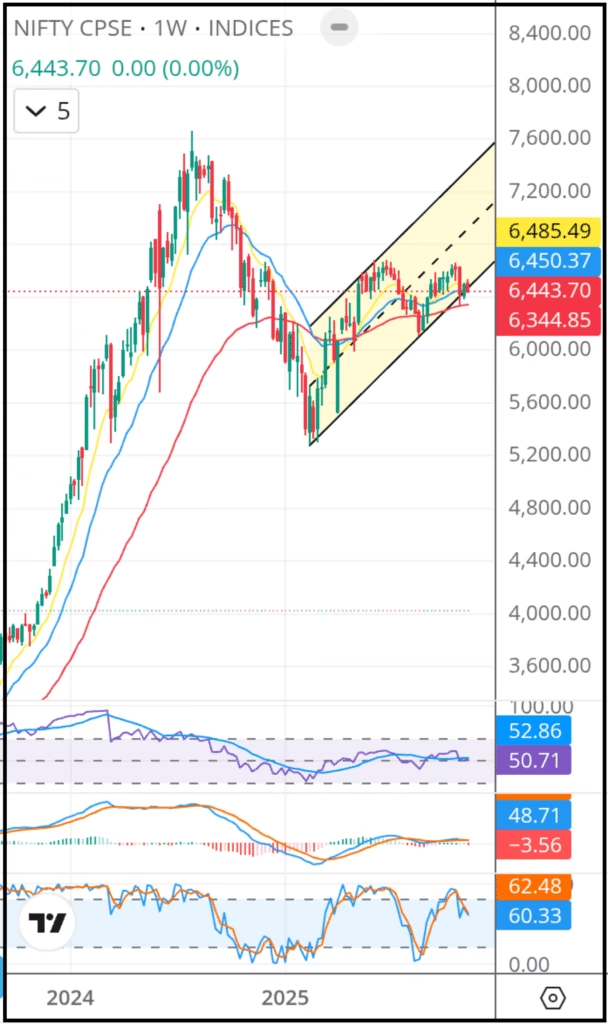
The weekly chart indicates that Nifty CPSE has been trending upward over the past year, although the recovery after pullbacks has been weaker than in the stronger-performing sectors. As a result, the index has formed only a few higher highs and higher lows, reflecting moderate strength.
Currently, the sector lies in a neutral zone.
Technical Overview:
Price remains above all major moving averages
Bullish EMA alignment:
10-week EMA > 20-week EMA > 50-week EMA > 200-week EMA
RSI around 51, indicating neutral momentum
Stochastics at 63, suggesting scope for continued upside
MACD showing a flat movement, signaling a likely range-bound phase
The sector may continue to move sideways with a mild upward bias.
Nifty Energy
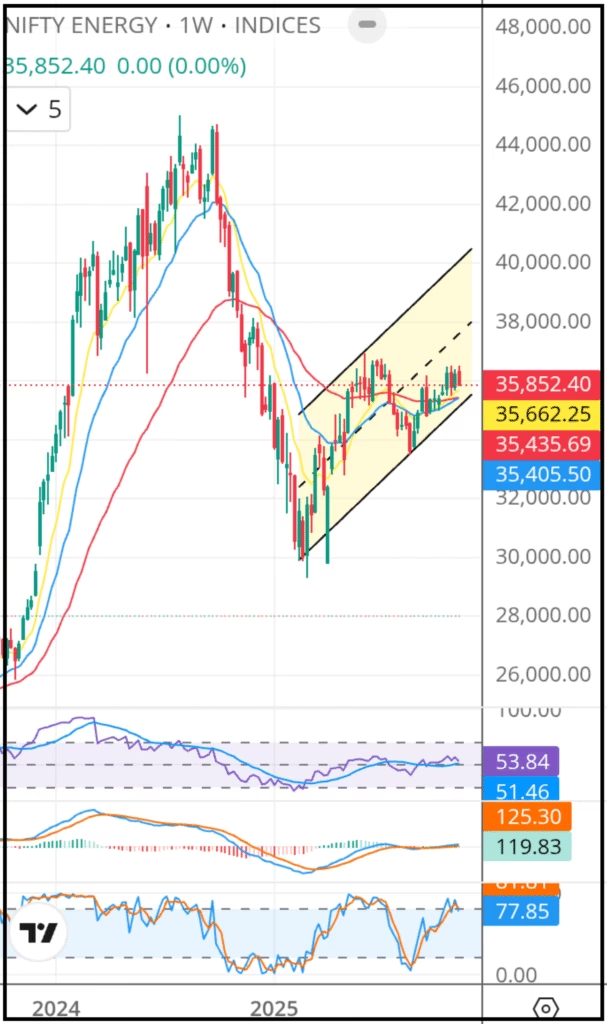
The weekly chart shows that Nifty Energy has been moving within an upward channel for the past year, but the recovery after corrections has been relatively slow. As a result, the index has registered only a limited number of higher highs and higher lows, indicating moderate strength compared to stronger sectors.
At present, the index remains in the neutral region.
Key Technical Signals:
Price trading above major moving averages
Bullish EMA structure:
10-week EMA > 20-week EMA > 50-week EMA > 200-week EMA
RSI around 54, reflecting neutral momentum
Stochastics at 78, indicating potential for continued upward movement
MACD showing a flattish pattern, supporting expectations of a range-bound trend
The sector may witness gradual movement with limited momentum until a clear breakout occurs.
Poor Performers
The sectors listed below exhibit weak technical structure and low momentum, making them less attractive from a trading and investment perspective at the moment. Their weekly trend channels clearly indicate a lack of strength, inconsistent recoveries, and inability to sustain upward movements.
Traders are advised to exercise caution when dealing with these four sectors, as they currently show limited bullish potential and higher downside risk.
Nifty FMCG
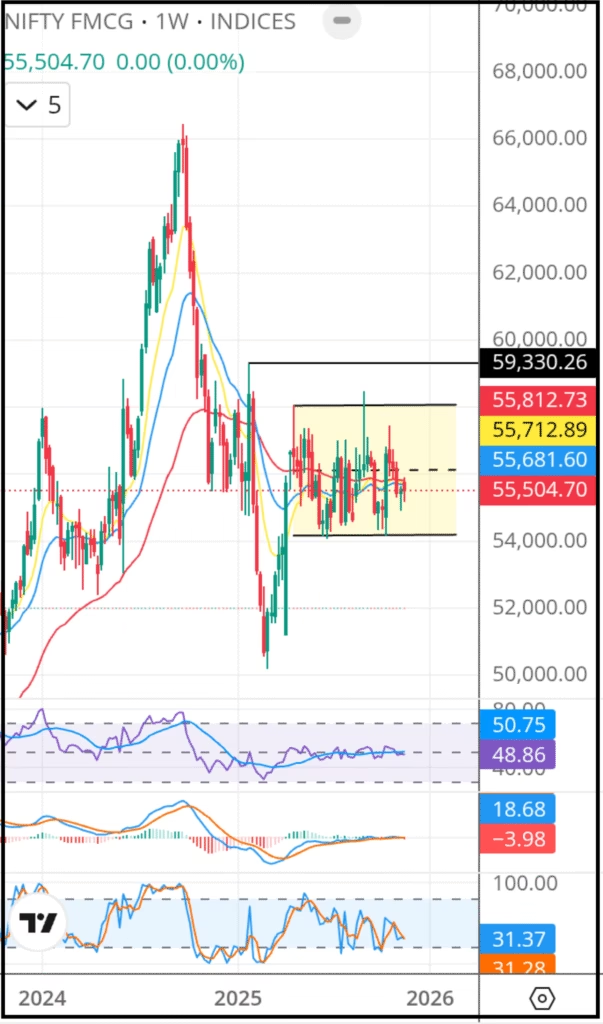
The sector is moving sideways after a major decline, forming a broad consolidation range. The absence of strong recovery signals suggests that momentum remains weak, and the sector may continue to trade within this sideways channel.
Nifty Reality
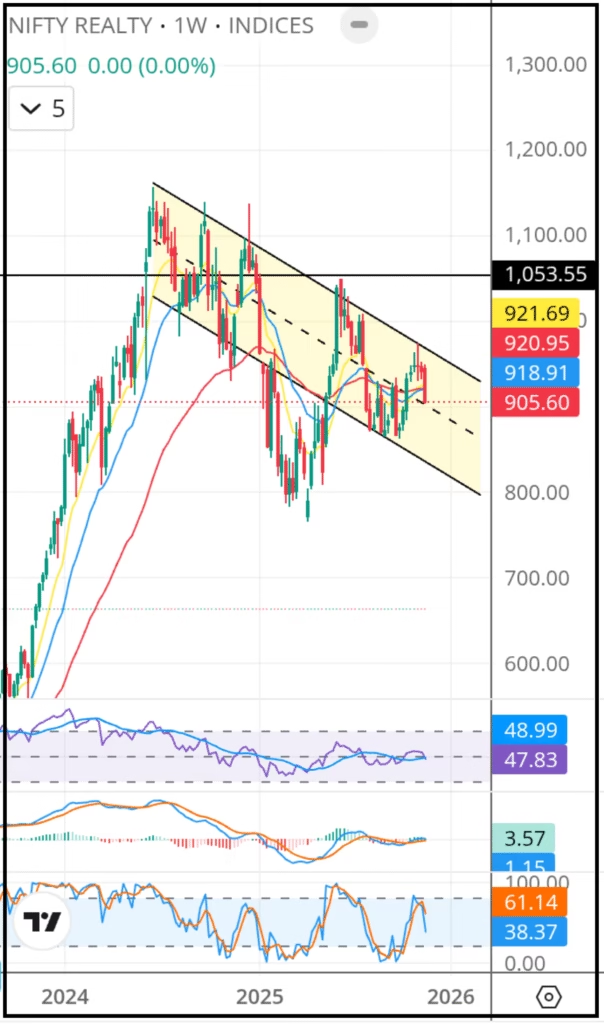
Nifty Realty has developed a clear downward channel and has not shown meaningful recovery. Attempts to rebound have been short-lived, indicating persistent selling pressure and structural weakness.
Nifty IT
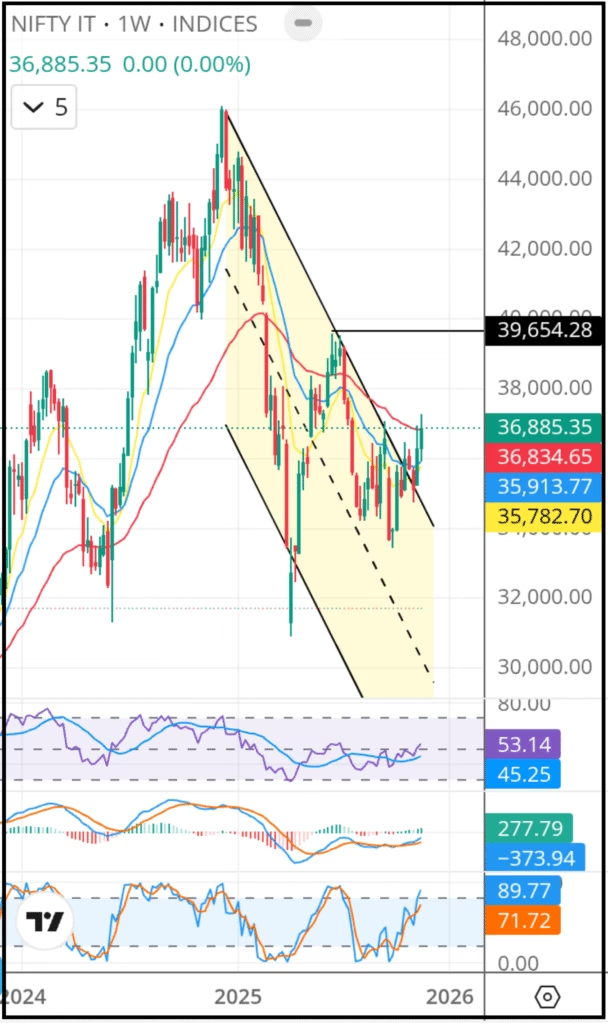
This sector has also formed a downward channel, and although it recently broke slightly above the upper trendline, the breakout lacks strength. The limited upside move raises concerns about sustainability, keeping the sector in a vulnerable position
Nifty Media
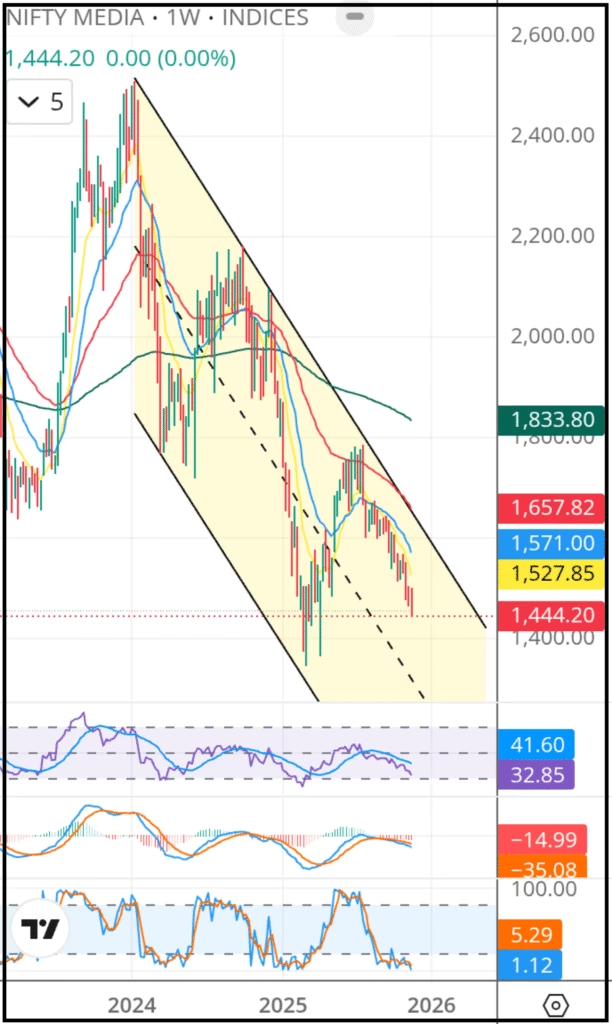
Nifty Media displays one of the weakest structures, having created a broad downward channel with no significant recovery. The sector continues to struggle, reflecting a prolonged bearish phase.
Overall, these sectors remain technically weak, and unless strong reversal patterns emerge, they may continue to underperform relative to the broader market.
Sectorwise Strength of Nifty Indices
| Sectors | Strength |
|---|---|
| Nifty Bank | Strong |
| Nifty Financial Services | Strong |
| Nifty Capital Market | Strong |
| Nifty Metal | Strong |
| Nifty Auto | Strong |
| Nifty Healthcare | Strong |
| Nifty Oil and Gas | Above Average |
| Nifty Energy | Average |
| Nifty Pharma | Average |
| Nifty CPSE | Average |
| Nifty FMCG | Below Average |
| Nifty Realty | Weak |
| Nifty IT | Weak |
| Nifty Media | Weak |
| Market Capitalisation | Strength |
| Nifty 50 | Strong |
| Niftty Midcap 150 | Strong |
| Nifty Smallcap 250 | Below Average |
📌 “Part of the Nifty Weekly Prediction Package – Click below to explore all predictions”

Read More