Introduction
The final weeks of the year often bring strong volatility in the Indian stock market. With global macro events, FII flows, and domestic earnings influencing market direction, it becomes important for investors and traders to understand the likely movement of the Nifty 50.
This article presents a clear outlook for 19 November to 31 December 2025, covering trend expectations, support and resistance levels, and the possible closing range of the index based on historical behaviour and long-term growth averages.
Topics of Discussion
India’s Economic Landscape in 2025: A Strong Foundation for Nifty 50 Growth
India’s economic environment in 2025 provides a solid backdrop for analyzing the Nifty 50 outlook for 19 November to 31 December 2025. As the world’s fastest-growing major economy and the fourth-largest economy by nominal GDP, India continues to display strength driven by domestic demand, controlled inflation, and consistent government-led capital expenditure. These macroeconomic factors play a crucial role in determining short-term and long-term market sentiment, directly influencing Nifty 50 trends.
Key Economic Indicators Supporting Market Stability (2025)
GDP Growth Forecast (FY25–26): 6.2% – 6.8%
CPI Inflation (July 2025): 1.55% YoY
FDI Inflows (FY24–25): USD 81.04 billion (provisional)
Unemployment Rate (2023–24): 3.2%
Forex Reserves: Approximately USD 698 billion
These numbers highlight a stable macroeconomic foundation, which typically supports positive equity market performance and helps reduce downside risk in the Nifty 50 index.
Why This Matters for Nifty 50 Trend & Levels
Strong Domestic Consumption boosts corporate earnings across major sectors included in the Nifty 50.
Government Capital Expenditure continues to support infrastructure, banking, and construction-related stocks.
Resilient Services & Manufacturing Sectors provide steady earnings visibility for the top Nifty companies.
Stable External Position & High Reserves help maintain FIIs’ confidence, limiting volatility even during global uncertainty.
These factors collectively support a constructive short-term outlook for the index and help in estimating Nifty 50 key levels, expected movement, and likely closing range for the period.
Economic Challenges to Consider
While the overall outlook remains positive, the index may still face short-term pressure from global trade tensions, crude oil volatility, and the cooling US economy. However, India’s strong fundamentals reduce recession risks and maintain a favorable environment for equity markets.
Current Trend Overview :
The Nifty 50 is currently showing a stable upward trend supported by higher highs and higher lows on the weekly chart.
The index continues to maintain strength above major moving averages.
India’s GDP growth, strong earnings, and stable inflation are supporting long-term bullish momentum.
FII activity remains a key determinant for short-term corrections and recoveries.
Table 1 : Current Trends of Nifty 50
| Type | Chart Used | Direction of Trend |
| Short Term | Daily | UP |
| Intermediate Term | Weekly | UP |
| Long Term | Monthy | UP |
Technical Prediction of Nifty 50 for Month ending December 31st
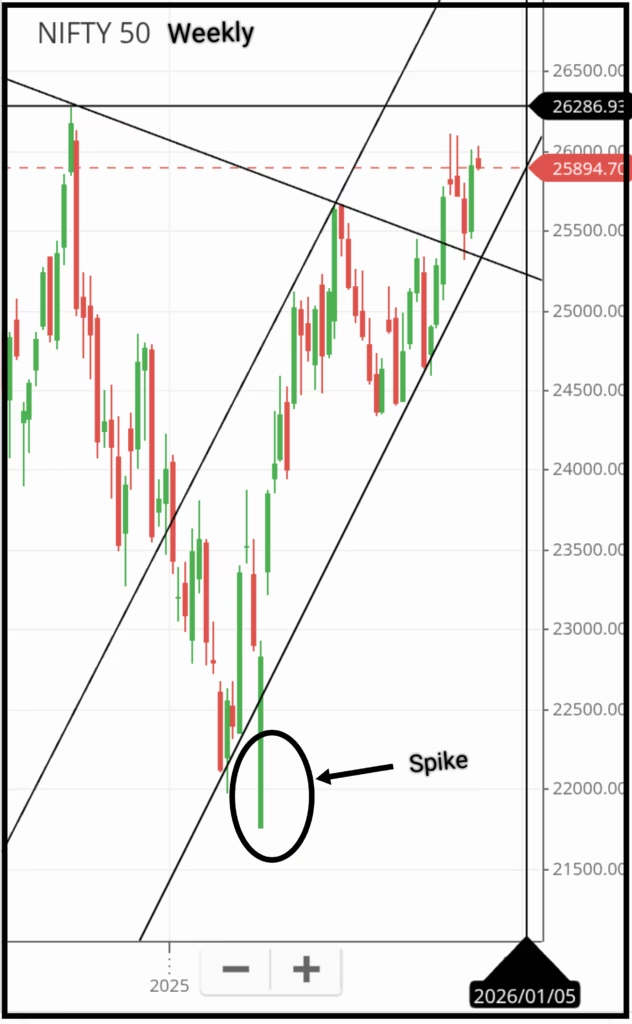
Chart Interpretation:
Nifty 50 began its strong upward trajectory from 3 March 2025, rising from a low of 21,964 to 25,910 by 18 November 2025, delivering an impressive CAGR of 28.13% during this period. The index has also formed a well-defined upward channel, and price movements have remained consistently within this structure. If Nifty 50 continues to maintain the same momentum and respects this channel throughout December, the projected value by 31 December 2025 stands at 26,677.
Why the level of 26,677 is achievable for Nifty 50 in December
- All three trends — short, intermediate, and long term — are firmly bullish
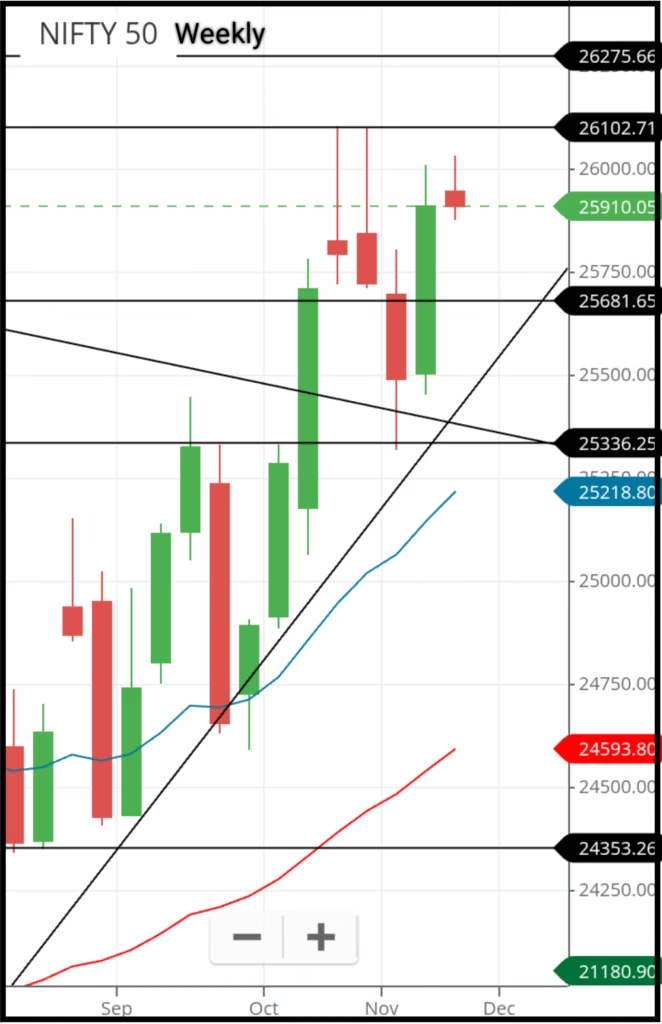
The short-term moving averages are positioned above intermediate averages, and both are above the long-term averages. This alignment is a classic sign of a strong bull market structure, indicating that buyers are consistently dominating across multiple timeframes. Such trend harmony reduces the probability of deep corrections and supports a steady upward grind.
- A clearly visible inverted head and shoulders pattern on the weekly chart
The weekly chart has formed a well-defined inverted Head & Shoulders, a powerful bullish reversal pattern. The breakout above the neckline has already occurred, and prices have sustained above this level. This pattern typically signals the start of a long-term upward cycle, often leading to multi-month rallies. The projected target of the pattern also aligns with Nifty’s next upside zone near the 26,500–27,000 region.
- Price action is respecting an up-trending channel
The index is currently oscillating within a rising parallel channel, which has guided the entire move since March 2025. Both the lower trendline (support) and upper trendline (resistance) have been tested multiple times, strengthening the validity of the structure. As long as Nifty trades within this channel, the natural path of movement favors higher levels. Based on the slope of the channel, the 26,600–26,700 zone fits perfectly as the expected December closing region.
- Successful breakout and sustained hold above a major 52-week trendline
Nifty recently broke a key downtrend line drawn from the previous 52-week high. Importantly, after the breakout, the index has held above this trendline for four consecutive weeks, confirming that the breakout is genuine and not a false move. Sustained holding above such a long-term resistance is often followed by a renewed rally as fresh institutional buying gets triggered.
- Strong and supportive economic conditions in India
India’s macroeconomic environment in 2025 remains one of the strongest among major economies. Robust GDP growth, a stable inflation outlook, expanding manufacturing activity, and increasing foreign investment continue to create a favourable foundation for equity markets. Corporate earnings have grown steadily across sectors, supported by structural reforms and rising domestic consumption. With India positioned as the fastest-growing major economy, investor confidence remains high, making upward movements in benchmark indices like the Nifty 50 fundamentally justified. This strong economic backdrop reduces downside risk and supports the possibility of Nifty advancing toward 26,677 in December.
Key Levels to Watch — Support and Resistance
In this section, we will refer to the major support and resistance levels that guide the medium- to long-term trend of Nifty 50.
For readers who are looking for daily support and resistance levels, please refer to the article linked below.

Nifty 50 Prediction for 17, 18, 19, 20 and 21 November with Trends and 35 Years of Historical Performance
Two Types of Support and Resistance
Nifty 50 follows two broad categories of support and resistance levels:
- Static Support and Resistance
- Dynamic Support and Resistance
Static Support and Resistance
Static support and resistance levels are formed by drawing horizontal lines from significant swing highs or swing lows on the chart. These levels remain constant until they are broken or retested.
Within the category of static levels, there is a sub-type known as psychological support and resistance. These levels occur near round numbers such as 25,000, 25,500, 26,000, or 26,500.
Market participants often react around these values, making them natural decision zones where buying or selling pressure increases.
The key static support and resistance levels are summarised in Table 2 below.
Table 2 : Static Support and Resistance
| Support 3 | 25,000 |
|---|---|
| Support 2 | 25,336 |
| Support 1 | 25,681 |
| Closing price | 25,910.05 |
| Resistance 1 | 26,000 |
| Resistance 2 | 26,275 |
| Resistance 3 | 26,500 |
Dynamic Support and Resistance
Dynamic support and resistance levels change continuously with price movements. The most reliable dynamic indicators include:
Exponential Moving Averages (EMAs):
The 20-period, 50-period, and 200-period EMAs act as strong dynamic support or resistance zones. Price often reacts sharply around these EMAs, especially during trending markets.
Trendlines and Trend Channels:
Diagonal trendlines and rising or falling channels also function as dynamic support and resistance. Their values vary depending on the timeframe and the slope of the trend.
The dynamic support and resistance levels relevant for 19 November are provided in Table 3 below.
Table 3 : Dynamic Supports
Dynamic Resistances are not available at this Stage
| 20 Week EMA | 25,218 |
|---|---|
| 50 Week EMA | 24,593 |
| 200 Week EMA | 21,180 |
| Trendline 1 | 25,581 |
| Trendline 2 | 25,350 |
Conclusion
The Nifty 50 outlook for 19 November to 31 December 2025 remains decisively positive, supported by strong market structure and India’s robust economic momentum. If the index sustains above near-term support zones and continues to respect the two strong weekly trendline supports, the broader trend is likely to remain upward.
A decisive move above the key resistance at 26,275 could open the path toward 26,677, and if market sentiment stays firm, Nifty may even extend the rally toward the 27,000 zone before the year wraps up.
With India steadily progressing toward becoming the world’s 3rd largest economy, the market’s long-term resilience remains intact. Strong GDP growth, stable macroeconomic conditions, and rising investor participation collectively reinforce a bullish bias for the closing weeks of 2025.
Overall, Nifty 50 is expected to deliver a consolidated yet upward-tilted finish to the year, supported by favourable domestic fundamentals and a technically strong chart structure.
Frequently Asked Questions (FAQ)
When is India expected to become the 3rd largest economy?
India is projected to become the world’s 3rd largest economy by 2030, supported by strong GDP expansion, rising consumption, and structural economic reforms.
2. How strong is India’s economic growth currently?
India continues to be one of the fastest-growing major economies, driven by domestic demand, infrastructure development, digital transformation, and rising investor participation.
3. What is the GDP growth forecast for FY25–26?
India’s GDP for FY25–26 is expected to grow between 6.2% and 6.8%, indicating stable macroeconomic conditions and continued economic resilience.
4. What is the expected Nifty 50 level by December 31, 2025?
Nifty 50 is projected to reach around 26,677 to 27,000 by the end of December 2025, supported by a strong technical and macroeconomic outlook.
5. What is the most important resistance level for Nifty 50?
The most crucial resistance level to watch is 26,275. A sustained breakout above this level can accelerate the trend toward 26,677–27,000.
6. Why is the level of 26,677–27,000 achievable for Nifty 50 in December 2025?
This level is achievable due to a combination of strong technical signals and supportive macro conditions:
All three trends — short, intermediate, and long term — are firmly bullish
A clear inverted head and shoulders pattern is visible on the weekly chart
Price is moving inside a well-defined up-trending channel
There has been a successful breakout above a major 52-week trendline
India’s economic conditions remain strong, boosting market sentiment
7. What are static support and resistance levels?
Static support and resistance are horizontal levels drawn from previous significant swing highs or swing lows.
These levels remain fixed and only change when price breaks or retests them.
What are psychological support and resistance levels?
Psychological levels are a type of static level that occur near round numbers such as 25,000, 25,500, 26,000, and 26,500.
These levels influence trader behavior and often act as natural barriers.
9. What are dynamic support and resistance levels?
Dynamic support and resistance change continuously based on price movement. Key dynamic tools include:
Exponential Moving Averages (EMAs) like the 20, 50, and 200 EMAs
Trendlines and trend channels that adjust with market direction
These indicators help identify trend continuation or potential reversals.
10. What are the current trends of the Nifty 50?
Currently, Short Term Trend, intermediate Term Trend and long term trend are bullish for Nifty 50.
Read More