Introduction
Economic Strength of India
What will India look like in 2050? Can it become the world’s third-largest economy in the near future, and eventually a developed nation by mid-century? These questions attract global attention, but the answer lies much closer than expected—in the long-term performance and projection of the Nifty 50 index.
The Nifty 50 is more than just a stock market benchmark. It is a mirror of India’s economic strength, business environment, and future growth potential. Since the index is made up of the country’s largest, most profitable, and professionally managed companies across key sectors—banking, infrastructure, manufacturing, IT, FMCG, energy, and more—its long-term trend is deeply connected to the structural growth of the Indian economy. When India’s GDP expands, corporate sales rise, profits increase, and the Nifty 50 climbs accordingly. Likewise, when the economy slows, the index reflects this weakness.
Over the last decade, this relationship has become even more visible. Both India’s GDP and the Nifty 50 have doubled, driven by rising consumption, global manufacturing shifts toward India, an expanding middle class, and massive government spending on roads, power, digital infrastructure, and logistics. The surge in bank credit, real estate development, and industrial production has strengthened the foundation for long-term value creation—directly benefiting the companies that constitute the Nifty 50.
This is why studying the long-term movement of the Nifty 50 offers a reliable view of India’s macroeconomic direction. If the index keeps rising over long periods, it signals expanding GDP, healthier corporate balance sheets, and growing investor confidence. Conversely, a stagnating market would indicate economic challenges. History shows that every major rise in India’s GDP has been accompanied by a sustained rally in the Nifty 50, proving that the index is a direct reflection of the nation’s economic performance.
As India enters a new era of manufacturing-led growth, infrastructure expansion, and financial-sector strengthening, the Nifty 50 continues to act as a real-time barometer of the country’s progress. And if the strong correlation of the past decade continues, India is well on its way to becoming the world’s third-largest economy and potentially a developed nation by 2050.
Topics of Discussion
Growing Interest in Stock Market Participation
Between 2008 and 2009, stock market participation in India dropped sharply, falling to just about 1–2% of the population. However, over the years, investor participation has grown steadily, reaching nearly 6% by early 2025. While this is still significantly lower than the United States—where over 60% of the population invests in equities—it highlights a massive untapped opportunity in India.
Tier 1 cities such as Delhi, Kolkata, Chennai, and Mumbai are leading in market awareness and investment activity. Tier 2 and Tier 3 cities are also showing steady growth, though at a slower pace. Given India’s large population base and expanding economic aspirations, the market potential is enormous and far from saturated. With India currently positioned as one of the fastest-growing major economies, while the U.S. is already a developed market, the long-term prospects for wealth creation in Indian equities remain highly promising.
Overall, there is a strong probability that the long-term uptrend in the Indian stock market will continue for the next two decades, offering investors a favourable environment to build wealth.
Nifty 50 Performance from Launch
Nifty 50 — Performance Summary
Launched: April 22, 1996 (Base: 1000)
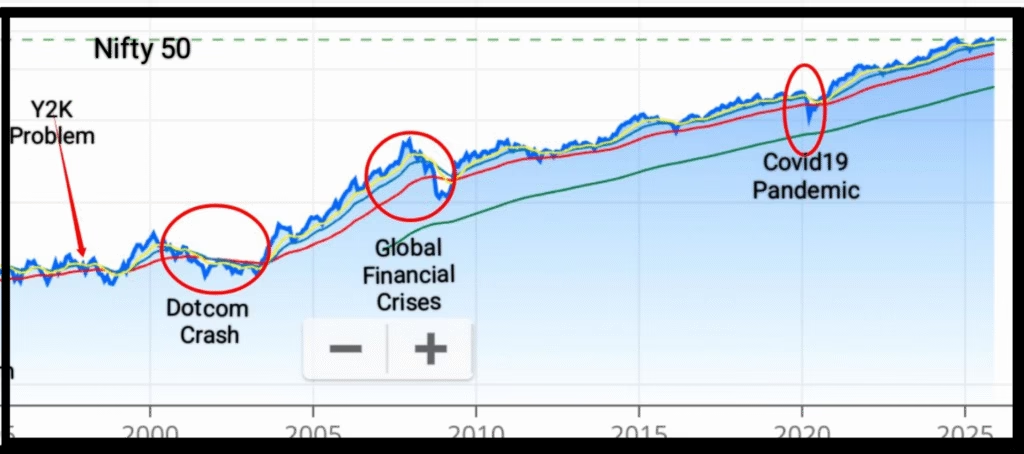
The Nifty 50 is India’s leading stock market index (NSE). Its long-term logarithmic chart shows steady growth despite four major downturns:
- Y2K (1998–2000)
- Dotcom Crash (2000–2004)
- Global Financial Crisis (2008–2009)
- COVID-19 (2020)
Over ~three decades the index returned ~2590% (CAGR ≈ 11.60%), reflecting India’s economic growth. Recoveries were solid: ~3.5 years after Dotcom, full recovery by 2012 after the GFC, and within one year after COVID-19.
With goals to become the world’s 3rd-largest economy by 2030 and a developed nation by 2047, India’s long-term equity outlook remains attractive.
For details about the performance of Nifty 50 refer to the article below

Nifty 50 Prediction for 17, 18, 19, 20 and 21 November with Trends and 35 Years of Historical Performance
Projection of Nifty 50 in Next 15 Years
Assumptions Before Starting the Nifty 50 Projection
Before estimating the future levels of the Nifty 50 index, a few key assumptions are considered:
- Future performance may broadly resemble past long-term performance.
Equity markets generally follow long-term economic growth trends, though the journey is rarely smooth. - Exact values cannot be predicted due to market volatility.
Projections provide approximate levels, not precise figures.
Long-Term Nifty 50 Prediction Methods
Long-term projections of the Nifty 50 can be approached using two methods:
- Method of Calculation (CAGR-Based Forecasting)
- Graphical Method
Method of Calculation (CAGR-Based Forecasting)
The Compound Annual Growth Rate (CAGR) of the Nifty 50 since its launch has averaged around 11.6% (as of 17 November 2025).
At a CAGR of 11.6%, the index grows by a factor of 1.116× every year.
At this pace, the Nifty doubles approximately every 6.4 years.
Understanding the Variations in Nifty 50 Predictions
There is considerable variation in long-term Nifty 50 growth forecasts. Different analysts project different annual returns—some estimate around 11%, others expect 12–14%, while a few anticipate more conservative growth of 9–10% over the next one or two decades. In summary, expert opinions generally fall within a broad range of 9% to 14% CAGR.
This divergence arises primarily because analysts use different historical periods for their calculations. Some rely on the past 10 years, others examine 5-year or 15-year data, and a few correlate market growth with economic expansion based on their personal experience and interpretation. Such differences in methodology naturally lead to different projections.
To provide clarity, a table has been prepared showing Nifty 50’s potential future values at growth rates ranging from 9% to 14% per year. This helps illustrate which growth trajectory the index appears to be following.
According to Md Raji, Analyst at SIRA, the expected long-term CAGR for the Nifty 50 over the coming decades is approximately 12%. At this pace, the index is likely to double every 6 years and 2 months, offering a strong foundation for long-term wealth creation.
Table 1 : Nifty 50 Projection for Next 15 Years
| Year End | Growth Rate 9% | Growth Rate 10% | Growth Rate 11% | Growth Rate 12% | Growth Rate 13% | Growth Rate 14% |
| Time to Double | 8 years and 1 month | 7 years and 4 months | 6 years and 8 months | 6 years and 2 months | 5 years and 8 months | 5 years and 4 months |
| 2026 | 28,329 | 28,589 | 28,848 | 29,108 | 29,368 | 29,628 |
| 2027 | 30,878 | 31,447 | 32,022 | 32,601 | 33,186 | 33,776 |
| 2028 | 33,657 | 34,592 | 35,544 | 36,514 | 37,500 | 38,505 |
| 2029 | 36,687 | 38,051 | 39,454 | 40,895 | 42,376 | 43,896 |
| 2030 | 39,988 | 41,857 | 43,794 | 45,803 | 47,884 | 50,041 |
| 2031 | 43,587 | 46,042 | 48,612 | 51,299 | 54,109 | 57,047 |
| 2032 | 47,510 | 50,647 | 53,959 | 57,455 | 61,144 | 65,033 |
| 2033 | 51,786 | 55,711 | 59,894 | 64,350 | 69,092 | 74,138 |
| 2034 | 56,447 | 61,283 | 66,483 | 72,072 | 78,075 | 84,518 |
| 2035 | 61,527 | 67,411 | 73,796 | 80,720 | 88,244 | 96,350 |
| 2036 | 67,065 | 74,152 | 81,914 | 90,407 | 99,694 | 1,09,839 |
| 2037 | 73,101 | 81,567 | 90,924 | 1,01,526 | 1,12,654 | 1,25,217 |
| 2038 | 79,680 | 89,724 | 1,00,926 | 1,13,407 | 1,27,299 | 1,42,747 |
| 2039 | 86,851 | 98,696 | 1,12,028 | 1,27,016 | 1,43,848 | 1,62,732 |
| 2040 | 94,668 | 1,08,566 | 1,24,351 | 1,42,257 | 1,62,548 | 1,85,515 |
| Profit % | 265% | 319% | 379% | 449% | 527% | 615% |
| Final Value | 3.65 Times | 4.19 Times | 4.79 Times | 5.49 Times | 6.27 Times | 7.15 Times |
Insights From the Above Nifty 50 Projection Table
The long-term projection table provides a clear picture of how the Nifty 50 may grow over the next 15 years under different CAGR assumptions (9% to 14%). Several important insights emerge:
- Nifty’s Doubling Time Falls Between 5 Years 4 Months and 8 Years 1 Month
Based on the growth ranges given (9%–14%), the index is expected to double anywhere between 5 years 4 months (at 14% CAGR) and 8 years 1 month (at 9% CAGR).
A balanced expectation lies at 6 years 2 months, assuming a long-term average CAGR of around 12%, which aligns with India’s historical market performance.
- Expected Nifty Level by 2030: Between 39,988 and 50,041
Across the different growth rates, the Nifty 50 projection for 2030 falls between:
Lower bound: 39,988 (9% CAGR)
Upper bound: 50,041 (14% CAGR)
A reasonable and balanced expectation is the 12% CAGR value: 45,803, which represents the midpoint of historical long-term trend behaviour.
- Expected Nifty Level by 2035: Between 61,527 and 96,350
For the year 2035, projections show:
Lower bound: 61,527 (9% CAGR)
Upper bound: 96,350 (14% CAGR)
An average expectation again lies at the 12% CAGR projection of 80,720, which is consistent with India’s structural growth and corporate earnings trajectory.
- Expected Nifty Level by 2040: Between 94,668 and 1,85,515
By 2040, the table predicts a wide range due to compounding:
Lower bound: 94,668 (9% CAGR)
Upper bound: 1,85,515 (14% CAGR)
A realistic central estimate is the 12% CAGR level of 1,42,257, representing a strong yet achievable long-term outcome.
- Long-Term Wealth Creation: 265% to 615% Return Over 15 Years
Holding Nifty for 15 years can generate returns between:
265% (at 9% CAGR)
615% (at 14% CAGR)
The most probable outcome lies at 449% profit, based on a 12% CAGR expectation.
- Wealth Multiplication: 3.65 Times to 7.15 Times in 15 Years
In terms of wealth multiplication:
Minimum: 3.65×
Maximum: 7.15×
A realistic median expectation is approximately 5.49×, again corresponding to a 12% CAGR.
Summary Insight
The table clearly shows that, despite market volatility, long-term returns remain consistent when viewed over 15-year cycles. Investors who stay invested in the Nifty 50 can reasonably expect their wealth to multiply around 5.5 times, with the index likely to follow the 12% long-term compound growth path India has historically delivered.
Also Read


Graphical Method
There are two Graphical methods
- Trendline-Based Projection
- Trend Channel Based Projection
Trendline-Based Projection
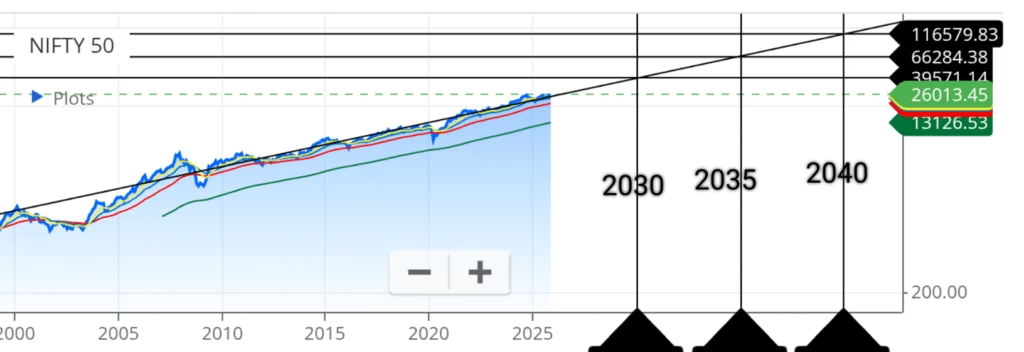
This method visually extends the long-term trend of the index:
Take the monthly closing chart of the Nifty 50 starting from April 1996.
Draw a straight trendline from the April 1996 value to the closing price on 14 November 2025.
Extend this trendline into the future.
Using your charting software’s crosshair tool, locate the price corresponding to any future date along the extended line.
This value becomes the projected Nifty level for that particular month.
This approach reflects long-term momentum and smooths out short-term volatility, making it a practical graphical forecasting technique.
Some figures from the projection system is given below in the table
Table 2 : Projection for Nifty 50 Based on Trendline
| Year | Projection values |
| 2030 | 39,571 |
| 2035 | 66,284 |
| 2040 | 1,16,580 |
Assumption of CAGR
Based on the last projected level — the Nifty 50 reaching 1,16,579 by 2040 if it continues to follow the established long-term trendline — we can derive a reasonable range for future returns. When this projection is compared with Table 1, it suggests that the long-term CAGR of the Nifty 50 is likely to fall between 10% and 11% under normal market conditions.
However, if the index begins to move above the trendline due to stronger-than-expected economic expansion, favourable policy cycles, or sustained earnings growth, the long-term returns may shift higher, potentially falling within the 12% to 14% CAGR range.
Considering both scenarios, and given India’s projected economic momentum, adopting a 12% CAGR appears to be a balanced and sensible assumption for forward-looking Nifty 50 projections.
Trend Channel Based Projection
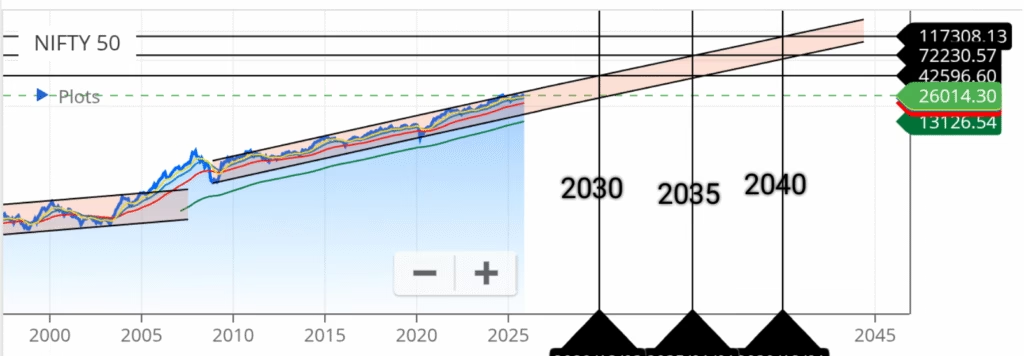
Insights from the Chart
The Nifty 50 has established two major long-term trend channels in the history of the Indian stock market.
The first channel extended from the index’s launch up to mid-2004, capturing the early structural growth phase of the Indian economy.
The second and more significant long-term channel began at the post–Global Financial Crisis low of 2008 and continues up to the present. This 17-year upward channel is formed by connecting the lows of 2008 (Global Financial Crisis) and 2020 (COVID-19 Pandemic). The lower boundary of this channel has demonstrated remarkable strength, acting as a resilient support line even during severe global disruptions. It is therefore unlikely that normal economic uncertainty will break below this long-term support.
A parallel upper trendline has been drawn to connect the major highs within this structure. By extending this channel into the future, we obtain a trend-based projection for the Nifty 50.
These extended trendlines indicate the possible index levels for 2030, 2035, and 2040, which are summarised in Table 3 below.
Table 3 : Projection For Nifty 50 Based on Trend Channel
| Year | Projection Values |
| 2030 | 42,596 |
| 2035 | 72,230 |
| 2040 | 1,17,308 |
Assumption of CAGR
Based on the latest projection — the Nifty 50 reaching 1,17,308 by 2040 if it continues to move within the established long-term trend channel shown in the chart — we can estimate a realistic range for future returns. When this projected level is compared with Table 1, it suggests that the long-term CAGR of the Nifty 50 is likely to be in the range of 10% to 11% under normal market conditions.
However, if the index begins to move above the upper trend channel, supported by stronger economic performance, structural reforms, or accelerated earnings growth, the long-term return potential may rise to the 12% to 14% CAGR range.
Considering both scenarios, and keeping in view India’s strong growth outlook, adopting a 12% CAGR serves as a balanced and prudent assumption for accurate long-term Nifty 50 projections.
Conclusion
Analysis:
Md Raji (Writer and Analyst, Smart Investello Research and Analysis) expects a strong and positive long-term outlook for the Nifty 50 over the next two decades. Based on trend-channel analysis and projected CAGR, the index is likely to cross the 1-lakh mark well before 2040.
The final rounded projections are as follows:
2030: ~46,000
2035: ~80,000
2040: ~1,42,000
Using This Opportunity Wisely
For investors with a long-term perspective, this period offers a compelling opportunity to participate in India’s growth story. Exposure to the Nifty 50 can be taken through Nifty 50 Index Funds and Nifty 50 ETFs, using either SIP or lumpsum strategies.
Those opting for a SIP can even begin with as little as ₹100, making it accessible to all types of investors.
Popular Nifty 50 Index Funds
- UTI Nifty 50 Index Fund
- HDFC Nifty 50 Index Fund
- ICICI Nifty 50 Index Fund
- SBI Nifty Index Fund
Popular Nifty 50 ETFs
- SBI Nifty 50 ETF
- Nippon India Nifty 50 ETF
- ICICI Prudential Nifty 50 ETF
- UTI Nifty 50 ETF
- Mirae Asset Nifty 50 ETF
- HDFC Nifty 50 ETF
- Kotak Nifty 50 ETF
- Axis Nifty 50 ETF
- Aditya Birla Nifty 50 ETF
- LIC Nifty 50 ETF
- Tata Nifty 50 ETF
Frequently Asked Questions (FAQ)
1. In which year is India expected to become the 3rd largest economy?
India is widely projected to become the world’s 3rd largest economy by 2030, supported by rapid GDP growth, rising consumption, and structural reforms.
2. When will India become a developed nation?
According to government targets and long-term economic forecasts, India aims to achieve developed nation status by 2047, coinciding with 100 years of independence.
3. What is the current market participation rate in India?
India’s market participation rate is around 6% of the total population, which is low but increasing rapidly due to digital platforms and financial literacy.
4. How many recessions has Nifty 50 faced since inception?
Nifty 50 has faced four major recessions:
Y2K Crisis (1998–2000)
Dotcom Crash (2000–2004)
Global Financial Crisis (2008–2009)
COVID-19 Crash (2020)
5. What assumptions are made before projecting Nifty 50 levels?
Key assumptions include:
Future performance may broadly resemble long-term historical trends.
Equity markets generally follow economic growth over time.
Exact values cannot be predicted due to volatility.
Projections indicate approximate levels—not guaranteed numbers.
6. What methods are used for long-term Nifty 50 prediction?
Long-term projections are estimated using two primary methods:
Method of Calculation (CAGR-Based Forecasting) and
Graphical Trendline Method
7. Which prediction method is more reliable?
Both methods are valuable. Reliability depends on the analyst’s approach, timeframe selected, and interpretation of historical data.
8. What is the projected value of Nifty 50 in 2030, 2035, and 2040?
Based on long-term growth assumptions, the estimated levels are:
2030: ~46,000
2035: ~80,000
2040: ~1,42,000
9. What will be the profit percentage by 2040?
By 2040, the projected profit is approximately 450%, meaning wealth may grow 5.5 times over the period.
10. What CAGR can investors expect for long-term Nifty 50 growth?
A long-term CAGR of around 12% is considered a reasonable and conservative expectation.
11.Which mutual funds are associated with the Nifty 50 index?
Popular Nifty 50 Index Funds include:
UTI Nifty 50 Index Fund
HDFC Nifty 50 Index Fund
ICICI Prudential Nifty 50 Index Fund
SBI Nifty Index Fund
12. What are the most popular Nifty 50 ETFs?
Top-traded Nifty 50 ETFs are:
SBI Nifty 50 ETF
Nippon India Nifty 50 ETF
ICICI Prudential Nifty 50 ETF
UTI Nifty 50 ETF
Mirae Asset Nifty 50 ETF
HDFC Nifty 50 ETF
Kotak Nifty 50 ETF
Axis Nifty 50 ETF
Aditya Birla Nifty 50 ETF
LIC Nifty 50 ETF
Tata Nifty 50 ETF
Related Posts