Introduction
Nifty 50 Prediction: 17, 18, 19, 20 and 21 November comes at a crucial time for traders who closely follow Resistance, support, projection levels, Weekly Performance, Historical Performance, Technical Analysis, Short Term Trend, Long term trend, medium term trend, and the broader Factors Affecting Nifty 50. This introduction highlights what this article offers, including a detailed breakdown of market behaviour, 35 years Historical performance insights, and the 6 Best Nifty Stocks for this week with Fabonacci projection levels, helping investors prepare for the upcoming sessions with clarity and confidence.
Topics of Discussion
Last Week’s Performance (10th to 14th November 2025)
Weekly Performance
The Nifty 50 index continued to demonstrate resilience during the week ending 14th November 2025, despite minor fluctuations in daily movements. The index opened at 25,503.50 on Monday and closed higher at 22,910.05 on Friday, recording a positive weekly change of 1.81%, which reflects market stability after weeks of steady gains.
Table 1 : Weekly Performance of Nifty 50 Index
| Particulars | Value |
|---|---|
| Open | 25503.5 |
| High | 26010.7 |
| Low | 25449.25 |
| Close | 25910.05 |
| Previous Close | 25492.30 |
| Gain | 460.80 |
| Gain % | 1.81 |
Short Term Trend, Medium Term trend & Long Term Trend
From a trend perspective, the Nifty 50’s market sentiment remains positive across all time frames — short-term (daily), intermediate (weekly), and long-term (monthly) charts continue to show an upward trajectory. This sustained uptrend highlights strong participation from bank stocks, with investors maintaining confidence in the segment’s growth potential.
Table 2 : Snapshot of Nifty 50 Trends
| Time frame | Chart used | Trend Direction |
|---|---|---|
| Short Term | Daily | Up |
| Intermediate Term | Weekly | Up |
| Long Term | Monthly | Up |
As the market heads into the week of 17th to 21st November 2025, the technical structure suggests ongoing strength, though selective consolidation may occur at higher levels. In this analysis, we will examine the technical summary, key patterns, and best stock opportunities within the Nifty 50 index to identify areas where investors can consider buying on dips or adding quality names for medium-term gains.
Technical Analysis of Nifty 50
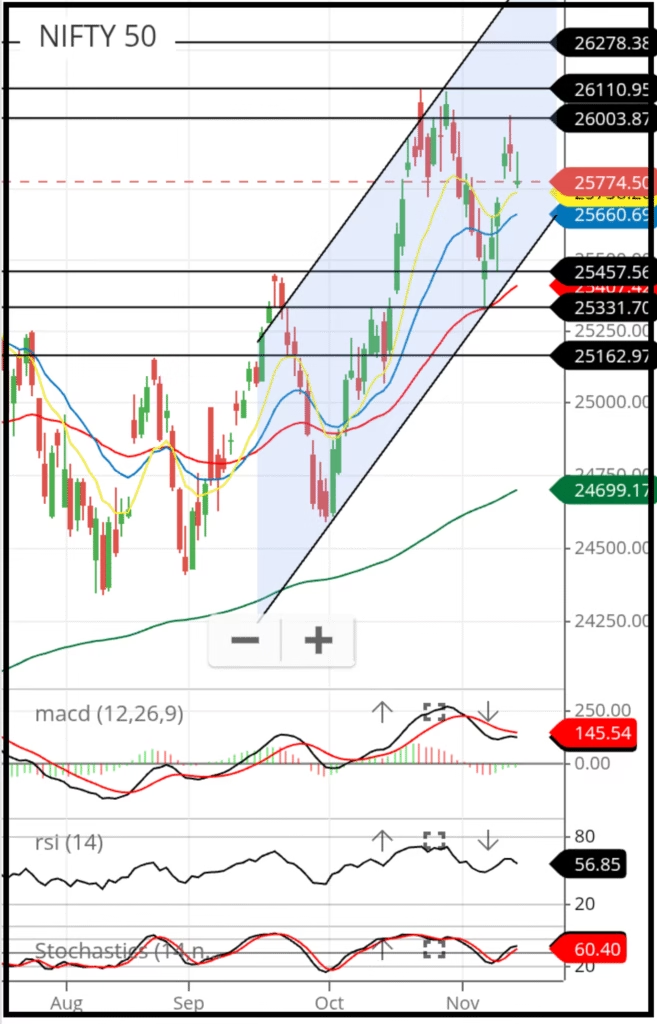
Chart Source Zerodha Kite
Chart Description
Candlestick Chart
This is a daily candlestick chart of the Nifty 50 index. Details and how to read the chart is shown in the article below

Nifty 50 : Prediction for 10th to 14th November 2025 with Factors Affecting it’s Performance
Nifty 50 weekly analysis: After breaking the 25,686 resistance and crossing 26,000, the index faced a short-term pullback to 25,318. While the intermediate and long-term trends remain bullish,...
Read More →Chart Inference
Chart Pattern
The Chart shows that the prices are moving between a fixed uptrending channel.
Nifty 50 is continuously creating higher highs and higher lows since 1st October 2025.
Support & Resistance Commentary
The Nifty 50 is currently positioned near multiple resistance levels, marked at 26,003, 26,110, and 26,278
In the near term, the immediate resistance lies at 26,003. If the index successfully breaches 26,003 on a closing basis, we may expect a further upward move toward the next resistance zone at 26,110.
Should the momentum continue and the index manage to sustain above 26,110, the next potential upside target becomes 26,278.
On the downside, the index has three key support levels placed at 25,457, 25,331, and 25,162.
If the index slips below the support at 25,457, the next likely downside test would be the zone around 25,331.
A further breakdown below 25,331 may drag the index toward the deeper support at 25,162, which is expected to act as a stronger cushion unless a major trend reversal takes place.
Table 3 : Supports And Resistances of Nifty 50
| Support 3 | 25162 |
| Support 2 | 25331 |
| Support 1 | 25457 |
| Closing | 25,910.05 |
| Resistance 1 | 26003 |
| Resistance 2 | 26109 |
| Resistance 3 | 26278 |
Interpretation of EMAs (20, 50, 200)
The price is currently above the 20 EMA, indicating a short-term bullish trend.
The price is currently above the 50 EMA, indicating an intermediate-term bullish trend.
The price is currently above the 200 EMA, indicating a long-term bullish trend.
Additionally, the 20 EMA is above the 50 EMA, which confirms a bullish intermediate trend.
The 50 EMA is above the 200 EMA, which confirms a bullish long-term trend.
When all three EMAs are aligned in the same direction (20 > 50 > 200 for bulls or 20 < 50 < 200 for bears), it strengthens the trend and reduces the probability of false signals.
Table 4 : Exponential Moving Averages (EMAs)
| EMA | Value | Comments | Inference |
|---|---|---|---|
| EMA – 10 | 25,750 | Below Price | Buy |
| EMA – 20 | 25,660 | Below Price | Buy |
| EMA – 50 | 25,407 | Below Price | Buy |
| EMA – 200 | 24,699 | Below Price | Buy |
Interpretation of RSI (14)
The current RSI (14) value is 57 . Since the RSI is above the 50-level threshold, market momentum currently favors the bulls.
The indicator is in the neutral zone, which suggests a potential a range bound movement . Traders should exercise caution and avoid initiating aggressive short positions at this stage. Instead, the preferred strategy is to buy on dips until the indicator confirms a clearer direction.
Interpretation of Stochastics
The current Stochastics (14) value is 60.4. Since the Stochastics is above the 50-level threshold, market momentum currently favors the bulls.
The indicator is in the neutral zone, which suggests a potential a range bound movement. Traders should exercise caution and avoid initiating aggressive short positions at this stage. Instead, the preferred strategy is to buy on dips until the indicator confirms a clearer direction.
Interpretation of MACD
The MACD value is currently 145.54, which is above the zero line. This indicates that the market is presently under the control of the bulls.
Additionally, the MACD line (black) is converging towards the signal line (red), which further confirms a bullish momentum shift. If there is a crossover within 1 to 2 trading days the prevailing uptrend is expected to continue.
However, MACD line has begun to converge toward the signal line, traders should be alert for a possible gain of momentum. A confirmed crossover would signal a buying opportunity.
Table 5 : Indicators
| Indicator | Value | Comments | Inference |
|---|---|---|---|
| RSI | 56.85 | Close to 50 Level | Neutral |
| Stochastics | 60.40 | Close to 50 Level | Neutral |
| MACD | 145.54 | Bullish crossover likely | Buy |
Technical Outlook:
Table 6 : Overall Technical Summary
| Object | Comments | Final Verdict |
|---|---|---|
| Trendline | up trending | Buy |
| EMAs | Below Price | Buy |
| RSI | Close to 50 | Neutral |
| Stochastics | Close to 50 | Neutral |
| MACD | Converging | Buy |
| Overall Outlook | Buy with strict stoploss | Buy |
Conclusion : Key Insights
The technical indicators collectively present a cautiously optimistic outlook for the market. The up-trending trendline, supportive EMA positioning, and a converging MACD all signal underlying bullish strength, resulting in multiple Buy verdicts. At the same time, RSI and Stochastics hovering near the 50 mark indicate a neutral momentum phase, suggesting that immediate directional clarity is limited. Bringing all elements together, the overall outlook remains “Buy with a strict stop-loss”, (or “buy value stock” like mentioned in the last section of this article) implying that while the market bias is positive, disciplined risk management is essential to safeguard against potential volatility.
Factors Affecting the Performance of Nifty 50
The Nifty 50’s performance is shaped by a mix of economic conditions, company-level developments, and regulatory or global events. Key macroeconomic factors such as inflation, interest rates, exchange rates, crude oil prices, and industrial production influence overall market direction. Company-specific elements—like earnings, growth prospects, and foreign investor activity—also play an important role in driving the index. Additionally, market sentiment can shift sharply due to global crises or geopolitical tensions, affecting investor behaviour. Policy decisions by the RBI, especially changes to interest rates, and regulatory updates introduced by SEBI further impact liquidity, trading conditions, and ultimately the Nifty 50’s movement.
Nifty 50 — 35 Year Overview
Launching of Nifty 50
Nifty 50, often referred to simply as “Nifty,” is one of India’s most prominent stock market indices, managed by the National Stock Exchange (NSE). Introduced on April 22, 1996, the Nifty 50 has grown to become a central benchmark of India’s capital markets, capturing a substantial share of the total market capitalization of companies listed on the NSE.
Chart Description
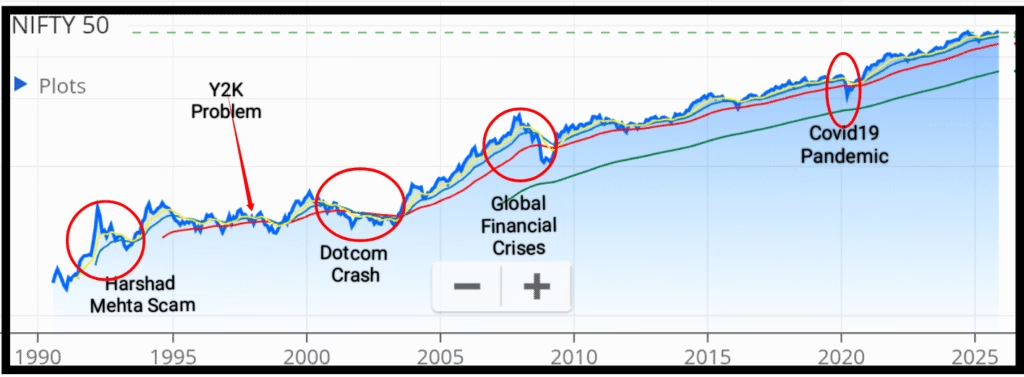
The chart represents reconstructed Nifty 50 data from 2 July 1990, built by back-calculation while keeping the same constituents that were part of the index on April 22, 1996. The graph is presented using a logarithmic scale to accurately reflect long-term market performance.
Five Major Recessions
Over the last 35 years, the Nifty 50 has faced five major recessionary phases:
- Harshad Mehta Scam (1992)
- Fear of the Y2K Problem (1998–2000)
- Dotcom Crash (Beginning 2000; impact lasted until 2004)
- Global Financial Crisis (2008–2009)
- COVID-19 Pandemic (January 2020 to March 2020)
Returns Over 35 Years
Despite these shocks, the index delivered an exceptional 9,175% total return over 35 years, which corresponds to a CAGR of 13.28%. This long-term performance highlights India’s consistent economic expansion.
India aims to become the world’s third-largest economy by 2030 and has a long-term vision to achieve developed nation status by 2047. These projections suggest that the market’s upward trajectory could continue for the next several decades, presenting a compelling opportunity for long-term investors. With geopolitical tension affecting China’s market, India has become an increasingly attractive investment destination in South Asia.
Recovery Time from Major Crashes
Harshad Mehta Scam (1992)
Following the scam, Nifty 50 declined for nearly nine months but recovered completely within a year. Nevertheless, lingering concerns related to Y2K kept the index in a narrow range until 1999, when a rebound followed the resolution of Y2K uncertainties.
Dotcom Crash (2000–2004)
Nifty 50 experienced a comparatively milder impact during the global dotcom crash because the index included only two IT stocks at the time—Infosys and Wipro. Even so, a slow downtrend persisted for about 3.5 years, from 2000 to 2004.
Global Financial Crisis (2008–2009)
This was among the most severe market declines in modern history:
- Nifty 50 plunged by approximately 55%.
- Midcap and Small-cap indices fell between 65–75%.
After one year of decline, the index recovered nearly 50% within the following year (2009–2010) and achieved full recovery by 2012.
COVID-19 Pandemic (2020)
The pandemic-led selloff resulted in a sharp three-month downturn from January to March 2020. Remarkably, the index regained all its losses within a year, supported by global liquidity and a rapid economic rebound.
Nifty 50 Stocks to Buy This Week
Given the sustained resilience in the Financial and Metal sectors, the following stocks have been selected from these two sectors for the upcoming week. Projection prices based on Fibonacci extensions are shown in the table 7 below.
- Tata Steel Ltd
- Hindalco Industries Ltd
- JSW Steel
- Bajaj Finance
- ICICI Bank
- State Bank of India
These stocks represent high-quality businesses available at reasonable valuations, selected in line with the investment principles of Warren Buffett and Charlie Munger. Each has the potential to compound consistently over the years. Both technical and fundamental analysis currently support a positive outlook for these picks.
Projection Prices — Fibonacci Extension Levels
Table 7 : Price Projection of Stocks
| Name of Stock | Closing Price on 13/11/2025 | Projection 1 at 1.375 Level | Projection 2 at 1.50 Level | Projection 3 at 1.625 Level | Projection 4 at 2.00 Level |
| Tata Steel Ltd | 176.65 | 196 | 203 | 210 | 230 |
| Hindalco Ltd | 811.95 | 857 | 885 | 913 | 998 |
| JSW Steel | 1183.90 | 1132 Target achieved | 1155 Target Achieved | 1177 Target Achieved | 1246 |
| Bajaj Finance | 1005.4 | 1104 | 1146 | 1188 | 1313 |
| ICICI Bank | 1385.9 | 1428 | 1450 | 1472 | 1538 |
| State Bank of India | 954.00 | 998 | 1027 | 1056 | 1142 |
Note: Fibonacci extension targets depend on the chosen swing high and swing low. To convert extension ratios into price levels, apply the formula: Target = Swing Low + (Swing High − Swing Low) × Extension Ratio (for an uptrend). Verify with live market data before placing trades and use proper risk management.
Frequently Asked Questions (FAQ)
1. How is the Nifty 50 performing at the moment?
The Nifty 50 remains in a strong uptrend across short-term, long-term, and intermediate-term timeframes, indicating sustained bullish momentum.
2. What are the key support levels for the Nifty 50?
Major support zones are currently placed at 25,457, 25,331, and 25,162, where buyers are likely to step in if the index dips.
3. What are the major resistance levels for the Nifty 50?
The index faces strong resistance near 26,003, 26,110, and 26,278, which could act as potential profit-booking areas.
4. What do the latest chart patterns indicate for Nifty 50?
On the daily chart, Nifty is moving within a clear upward channel, while the weekly chart shows an inverted head and shoulders pattern, both signalling bullish continuation.
5. What are RSI and Stochastics indicating right now?
Both oscillators are currently in the neutral zone, suggesting consolidation and the possibility of a fresh upward rally if momentum improves.
6. What does the MACD reveal about Nifty’s momentum?
MACD is converging toward the signal line, hinting that upward momentum may strengthen in the coming sessions.
7. What factors influence the performance of the Nifty 50?
Nifty 50 is driven by multiple variables including inflation, interest rates, currency movement, crude oil prices, industrial production, corporate earnings, FII/DII activity, geopolitical events, and policy updates by RBI and SEBI.
8. How many major recessions or crashes has Nifty faced in the last 35 years?
Nifty has undergone five major recessionary or crash phases:
Harshad Mehta Scam (1992)
Y2K Fear (1998–2000)
Dotcom Crash (2000–2004)
Global Financial Crisis (2008–2009)
COVID-19 Crash (Jan–Mar 2020)
9. What has been the return of the Nifty 50 over the last 35 years?
The Nifty 50 has delivered an extraordinary 9,175% total return, equivalent to a 13.28% CAGR over 35 years, establishing it as one of the most reliable long-term wealth creators.
10. How long does Nifty 50 usually take to recover from a major crash?
Historically, Nifty has taken around 1 to 2 years to fully recover after severe corrections or bear phases.
11. What macroeconomic and market factors affect Nifty 50 movement?
Key drivers include inflation, interest rate decisions, exchange rate fluctuations, crude oil price trends, manufacturing output, corporate earnings, global market sentiment, geopolitical risks, RBI monetary policy, and SEBI regulations.
12. Which stocks are recommended to buy this week and what returns can be expected?
This week’s strong picks include:
Tata Steel Ltd
Hindalco Industries Ltd
JSW Steel
Bajaj Finance
ICICI Bank
State Bank of India
Potential gains could range between 10% and 20%, depending on market conditions and trend continuation.
Weekly Close: 25,910.05
(Change: +460.8 points(+1.81%)
Read More