

Introduction- Recent Performance of Bank Nifty
The Bank Nifty index continued to demonstrate resilience during the week ending 7th November 2025, despite minor fluctuations in daily movements. The index opened at 57726.85 and closed marginally lower at 57776.85, recording a negligible weekly change of 0.17%, which reflects market stability after weeks of steady gains.
From a trend perspective, the Bank market sentiment remains positive across all time frames — short-term (daily), intermediate (weekly), and long-term (monthly) charts continue to show an upward trajectory. This sustained uptrend highlights strong participation from bank stocks, with investors maintaining confidence in the segment’s growth potential.
As the market heads into the week of 10th to 14th November 2025, the technical structure suggests ongoing strength, though selective consolidation may occur at higher levels. In this analysis, we will examine the technical summary, key patterns, and best opportunities within the Bank Nifty index to identify areas where investors can consider buying on dips or adding quality bank names for medium-term gains.
Topics of Discussion
Table 1 : Weekly Performance of Bank Nifty
| Particulars | Value |
|---|---|
| Open | 57726.85 |
| High | 58247.55 |
| Low | 57157.85 |
| Close | 57876.80 |
| Previous Close | 57776.35 |
| Gain | 100.45 |
| Gain % | 0.17 |
Table 2 : Snapshot of Bank Nifty Trends
| Time frame | Chart used | Trend Direction |
|---|---|---|
| Short Term | Daily | Up |
| Intermediate Term | Weekly | Up |
| Long Term | Monthly | Up |
Technical Analysis of Bank Nifty
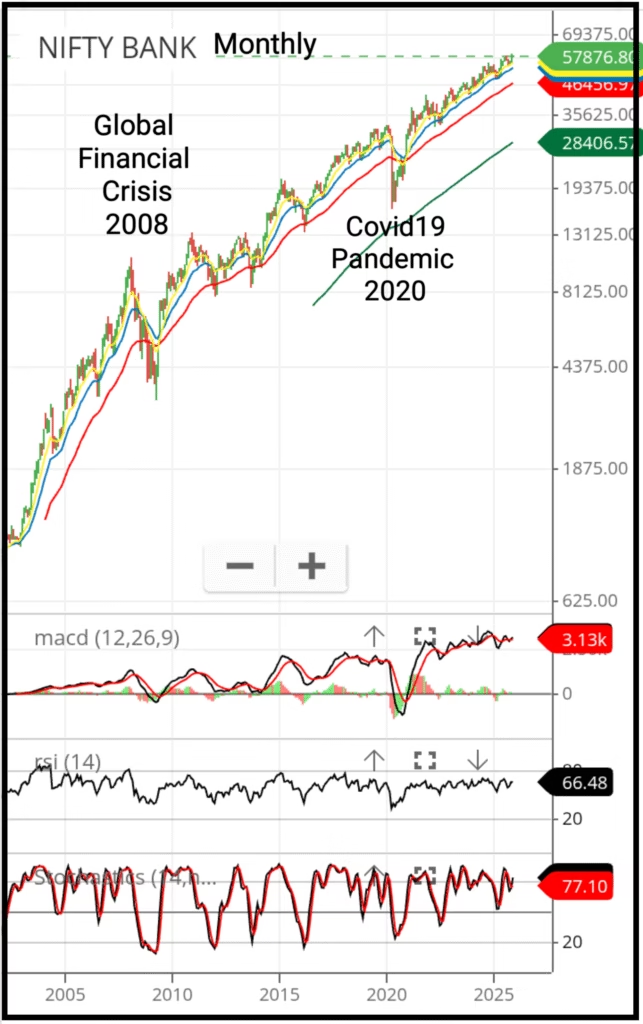
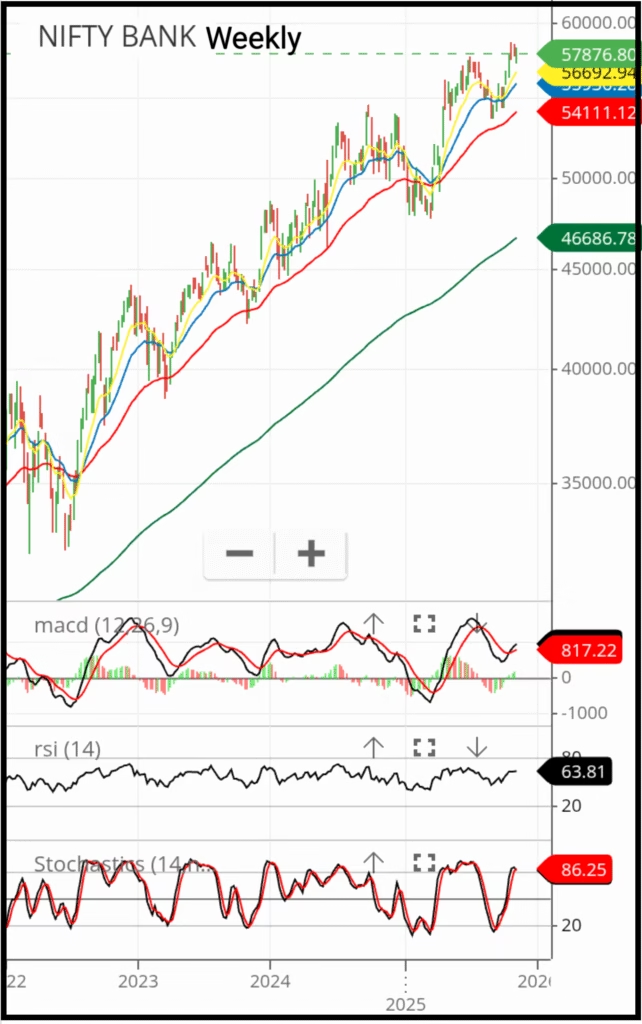
Chart Source Zerodha Kite
Chart Description
Candlestick Chart
Charts used in this article are monthly, weekly and daily candlestick chart of the Bank Nifty index. Details and how to read the chart is shown in the article below

Nifty 50 : Prediction for 10th to 14th November 2025 with Factors Affecting it’s Performance
Nifty 50 weekly analysis: After breaking the 25,686 resistance and crossing 26,000, the index faced a short-term pullback to 25,318. While the intermediate and long-term trends remain bullish,...
Read More →Chart Inference
Monthly Chart of Bank Nifty
A Safe Bet — Buy and Forget
The monthly candlestick chart of Bank Nifty, plotted from 2004 to the present on a logarithmic scale, highlights one consistent truth — the index rarely stays at the bottom for long. Over this period, it has delivered an impressive return of nearly 6,550%, reflecting its enduring strength and resilience.
Historically, every time Bank Nifty touched its 20-month or 50-month Exponential Moving Average (EMA), it rebounded sharply. This pattern reinforces the fact that the long-term trend of Bank Nifty remains decisively upward.
Even during major global events such as the 2008 financial crisis and the COVID-19 pandemic, the index slipped below its 50-month EMA but rebounded with remarkable momentum afterward. This resilience makes Bank Nifty a reliable long-term investment vehicle — a true “buy and forget” candidate.
For long-term investors, maintaining positions during market downturns and waiting patiently for recovery has historically proven rewarding. Additionally, Bank Nifty tends to be less volatile compared to other sectoral indices within the Nifty family.
Starting a Systematic Investment Plan (SIP) today in Bank ETFs such as BankBees, BankNifty1, BankNifty, or BankIETF could be a wise move. Such disciplined, long-term exposure to the banking sector can serve as a wealth-building strategy that pays off over a lifetime.
Weekly Chart of Bank Nifty
The weekly chart, drawn from 2022 to the present, shows that Bank Nifty has delivered over 60% returns during this period. For intermediate-term traders, this makes it an ideal index for employing a buy-on-dips strategy.
Each time the index has touched or moved slightly below the 50-week EMA, it has staged a strong rebound. Traders with a higher risk appetite may also consider using the 20-week moving average, but with a strict stop-loss discipline.
Frequent reshuffling of trades is unnecessary. With consistent discipline, this one index — Bank Nifty — can generate lifetime trading opportunities.
At the current juncture, however, it’s prudent to wait for a correction. A better entry point would be when the index approaches its 20-week EMA, presently placed near 55,556 levels.
Daily Chart of Bank Nifty
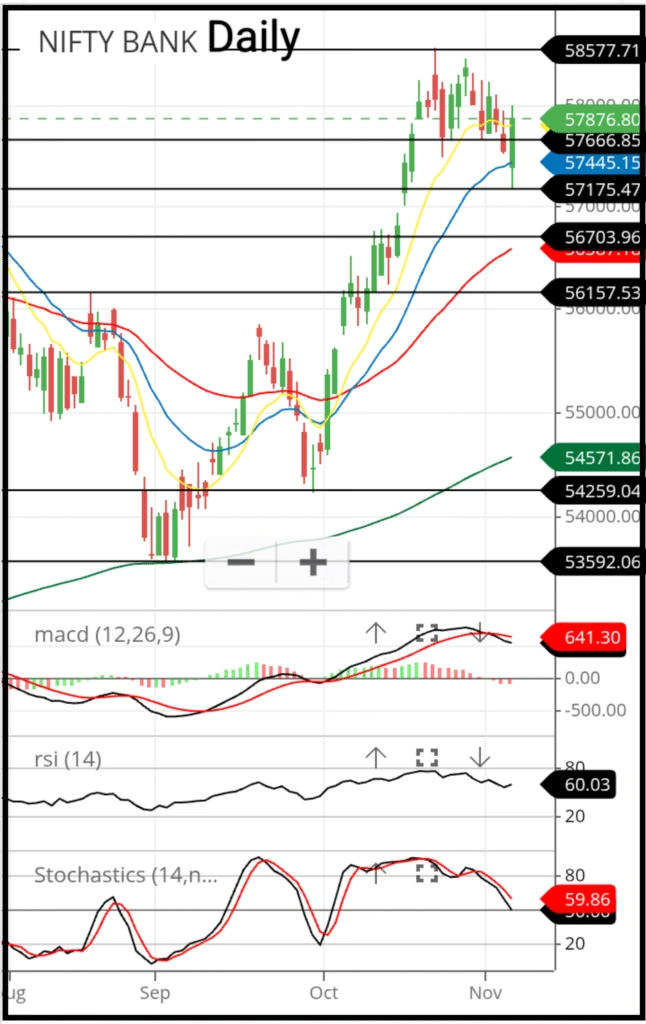
Chart Pattern Analysis
On the daily timeframe, Bank Nifty has been forming higher highs and higher lows consistently since the first week of September 2025, signaling a strong short-term uptrend.
Before this rally began, the index completed the formation of an inverted head and shoulders pattern around the beginning of October 2025 — a classic bullish reversal pattern that set the stage for the current upward momentum.
Support & Resistance Commentary
The Bank Nifty is currently positioned near a single resistance level, marked at 58577. After this level psychological levels has to be considered.
In the near term, the immediate resistance lies at 58577. If the index successfully breaches 58577 on a closing basis, we may expect a further upward move toward the next resistance zone at 59000.
Should the momentum continue and the index manage to sustain above 59000, the next potential upside target becomes 59000 to 60,000.
On the downside, the index has three key support levels placed at 57666, 57175, and 56703.
If the index slips below the support at 57666, the next likely downside test would be the zone around 57175.
A further breakdown below 57175 may drag the index toward the deeper support at 56703, which is expected to act as a stronger cushion unless a major trend reversal takes place.
Table 3 : Supports And Resistances of Bank Nifty
| Support 3 | 56703 |
| Support 2 | 57175 |
| Support 1 | 57666 |
| Closing | 57876.80 |
| Resistance 1 | 58577 |
| Resistance 2 | 59000 (psychological ) |
| Resistance 3 | 59500 and 60,000 (Psychological) |
Interpretation of EMAs (20, 50, 200)
The price is currently above the 20 EMA, indicating a short-term bullish trend.
The price is currently above the 50 EMA, indicating an intermediate-term bullish trend.
The price is currently above the 200 EMA, indicating a long-term bullish trend.
Additionally, the 20 EMA is above the 50 EMA, which confirms a bullish intermediate trend.
The 50 EMA is above the 200 EMA, which confirms a bullish long-term trend.
When all three EMAs are aligned in the same direction (20 > 50 > 200 for bulls or 20 < 50 < 200 for bears), it strengthens the trend and reduces the probability of false signals.
Table 4 : Exponential Moving Averages (EMAs)
| EMA | Value | Comments | Inference |
|---|---|---|---|
| EMA – 10 | 57800 | Below Closing | Buy |
| EMA – 20 | 57445 | Below Closing | Buy |
| EMA – 50 | 56587 | Below Closing | Buy |
| EMA – 200 | 54155 | Below Closing | Buy |
Interpretation of RSI (14)
The current RSI (14) value is 60.03. Since the RSI is above the 50-level threshold, market momentum currently favors the bulls.
The indicator is in neutral zone, which suggests a potential range bound movement. Traders should exercise caution and avoid initiating aggressive short positions at this stage. Instead, the preferred strategy is to buy on dips until the indicator confirms a clearer trend.
Interpretation of Stochastics
The current Stochastics value is 59.86. Since the Stochastics is above the 50-level threshold, market momentum currently favors the bulls.
The indicator is in neutral zone, which suggests a potential range bound movement. Traders should exercise caution and avoid initiating aggressive short positions at this stage. Instead, the preferred strategy is to buy on dips until the indicator confirms a clearer trend.
Interpretation of MACD
The MACD value is currently 641.3, which is above the zero line. This indicates that the intermediate trend is presently under the control of the bulls.
But, the MACD line (black) is below the signal line (red), which further confirms a bearish momentum shift. This recent crossover indicates in short term a meaningful correction is on the cards.
However, if the MACD line begins to converge toward the signal line, traders should be alert for a possible reversal. A confirmed crossover in the opposite direction would signal a fresh buying opportunity.
Table 5 : Indicators
| Indicator | Value | Comments | Inference |
|---|---|---|---|
| RSI | 60.03 | Positive Divergence | Buy |
| Stochastics | 59.86 | Negative Divergence | Sell |
| MACD | 641.30 | Negative Crossover | Sell |
Technical Outlook:
Overall technical bias and expected price action
Table 6 : Overall Technical Summary
| Object | Comments | Final Verdict |
|---|---|---|
| Chart Pattern | Positive intermediate Trend | Buy |
| EMAs | All Bullish | Buy |
| RSI | Upward Slope | Buy |
| Stochastics | Downward Slope | Sell |
| MACD | Negative Crossover | Sell |
| Overall Outlook | A meaningful Correction is expected | Short term -Sell Intermediate Term – Buy |
Key Insights / Conclusion
The overall technical setup suggests a mixed sentiment in the short term but a constructive outlook over the intermediate horizon. While the chart pattern and EMAs indicate strong bullish momentum, both Stochastics and MACD signal short-term weakness, hinting at a possible near-term correction.
However, the RSI’s upward slope confirms underlying strength, implying that any dip could be a healthy pullback rather than a trend reversal. Therefore, the short-term view remains cautious (Sell), but the intermediate-term trend stays positive (Buy)—offering opportunities for accumulation on declines.
Read More


57876.80
Change: 100.45 points (0.17%)