
Introduction – Performance of Nifty Smallcap 250
7th November 2025 – The Nifty Smallcap 250 index continued to demonstrate weakness during the week ending 7th November 2025, despite minor fluctuations in daily movements. The index opened at 17335.15 and closed marginally lower at 17020.05 recording a weekly change of –293.85 points or -1.70%, which reflects market instability after weeks of upward but range bound movement.
From a trend perspective, the Smallcap market sentiment remains negative to flat across time frames — short-term (daily) and intermediate (weekly). But long-term (monthly) charts continue to show an upward trajectory. This sustained sideways movement highlights lack of interest in participation from smallcap stocks, with investors maintaining a cautious sentiment in the smallcap segment.
As the market heads into the week of 10th to 14th November 2025, the technical structure suggests ongoing weakness, though selective upside move may occur at lower levels. In this analysis, we will examine the technical summary, key patterns, and best stock opportunities within the Nifty Smallcap 250 index to identify areas where investors can consider buying on support levels or adding quality Smallcap names for medium-term gains.
Topics of Discussion
Table 1 : Weekly Performance of Nifty Smallcap 250
| Particulars | Value |
|---|---|
| Open | 17335.15 |
| High | 17466.15 |
| Low | 16825.05 |
| Close | 17020.05 |
| Previous Close | 17313.90 |
| Gain | -293.85 |
| Gain % | -1.70 |
Table 2 : Market Trends of Nifty Smallcap 250
| Time frame | Chart used | Trend Direction |
|---|---|---|
| Short Term | Daily | Down |
| Intermediate Term | Weekly | Neutral |
| Long Term | Monthly | Up |
Technical Analysis of Nifty Smallcap 250
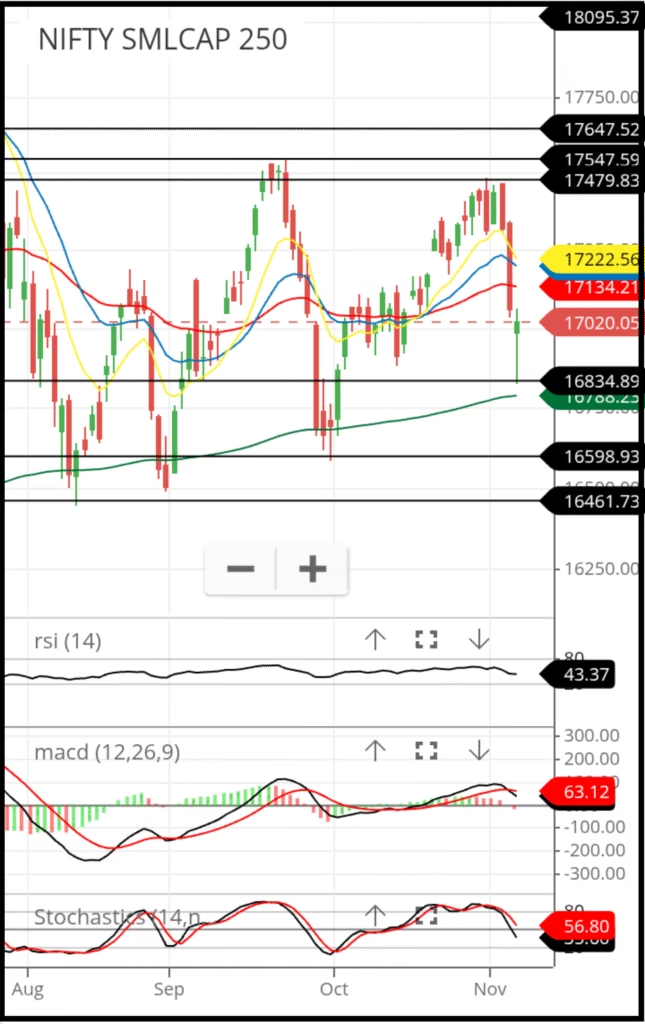
Chart Source Zerodha Kite
Chart Description
Candlestick Chart
This is a daily candlestick chart of the Nifty Smallcap index. Details and how to read the chart is shown in the article below.

Nifty 50 : Prediction for 10th to 14th November 2025 with Factors Affecting it’s Performance
Nifty 50 weekly analysis: After breaking the 25,686 resistance and crossing 26,000, the index faced a short-term pullback to 25,318. While the intermediate and long-term trends remain bullish,...
Read More →Chart Inference:
Chart Pattern
The Nifty Smallcap 250 index has failed to form consecutive higher highs and higher lows since August 2025. Following this phase, the index has been trading within a narrow range between 16,461 and 17,547, indicating a flag pattern in technical analysis terms.
This pattern reflects a period of consolidation after a prior move, suggesting that prices are pausing before the next significant breakout. The inability of the index to sustain higher levels signals cautious sentiment among investors.
For traders with a high-risk appetite, opportunities exist to buy near the support level of 16,461 and short-sell near the resistance of 17,547. However, a decisive breakout—either above or below this range—is essential for confirming the next directional trend. Historically, flag pattern breakouts are often accompanied by strong volume and high momentum, validating the strength of the move.
Support & Resistance Commentary
The Nifty Smallcap 250 is currently positioned near multiple resistance levels, marked at 17479, 17547, and 17647.
In the near term, the immediate resistance lies at 17479. If the index successfully breaches 17479 on a closing basis, we may expect a further upward move toward the next resistance zone at 17547.
Should the momentum continue and the index manage to sustain above 17547, the next potential upside target becomes 17647.
On the downside, the index has three key support levels placed at 16834, 16598, and 16461.
If Nifty Smallcap 250 slips below the support at 16834, the next likely downside test would be the zone around 16598.
A further breakdown below 26598 may drag the index toward the deeper support at 16461, which is expected to act as a stronger cushion unless a major trend reversal takes place.
Table 3 : Supports And Resistances
| Support 3 | 16461 |
| Support 2 | 16598 |
| Support 1 | 16834 |
| Closing | 17020.05 |
| Resistance 1 | 17479 |
| Resistance 2 | 17547 |
| Resistance 3 | 17647 |
Interpretation of EMAs (20, 50, 200)
The price is currently below the 20 EMA, indicating a bearish trend.
The price is currently below the 50 EMA, indicating an intermediate-term bearish trend.
The price is currently above the 200 EMA, indicating a long-term bullish trend.
Additionally, the 20 EMA is above the 50 EMA, which confirms a bullish intermediate trend.
So there lies a confusion in determining the direction of intermediate Term trend. This confusion means no clear direction of intermediate Term trend
The 50 EMA is above the 200 EMA, which confirms a bullish long-term trend.
Table 4 : Exponential Moving Averages (EMAs)
| EMA | Value | Comments | Inference |
|---|---|---|---|
| EMA – 10 | 17222 | Above Closing Price | Sell |
| EMA – 20 | 17163 | Above Closing Price | Sell |
| EMA – 50 | 17134 | Just Above Closing Price | Neutral |
| EMA – 200 | 16788 | Below Closing Price | Buy |
Interpretation of RSI (14)
The current RSI (14) value is 43.37. Since the RSI is below the 50-level threshold, market momentum currently favors the bears.
The indicator is in neutral zone, which suggests a range bound market.Traders should exercise caution and avoid initiating aggressive long positions at this stage. Instead, the preferred strategy is to buy near support and sell near resistance until the indicator confirms a clearer trend.
Interpretation of Stochastics
The current Slow Stochastics value is 56.80. Since the Stochastics is above the 50-level threshold, market momentum currently favors the bulls.
The indicator is in neutral zone, which suggests a potential a range bound market. Traders should exercise caution and avoid initiating aggressive long positions at this stage. Instead, the preferred strategy is to buy near support and sell near resistance and maintain a strict stoploss until the confirms a clearer trend.
Interpretation of MACD
The MACD value is currently 63.12 which is above the zero line. This indicates that the market is presently under the control of the bulls
But, the MACD line (black) is below the signal line (red), which further confirms a bearish momentum shift. As long as this crossover remains intact, the prevailing short term down trend is expected to continue.
However, if the MACD line begins to converge toward the signal line, traders should be alert for a possible reversal. A confirmed crossover in the opposite direction would signal a fresh buying opportunity.
Table 5 : Indicators
| Indicator | Value | Comments | Inference |
|---|---|---|---|
| RSI | 43.37 | Below 50 | Sell |
| Stochastics | 56.80 | Negative Divergence | Sell |
| MACD | 63.12 | Bearish Crossover | Sell |
Technical Outlook:
Table 6 : Overall Technical Summary
| Object | Comments | Final Verdict |
|---|---|---|
| Chart Pattern | Flag Pattern | Range bound movement |
| EMAs | Short and intermediate term Bearish | Sell |
| RSI | Below 50 | Sell |
| Stochastics | Down ward Slope | Sell |
| MACD | Bearish Crossover | Sell |
| Overall Outlook | Range bound movement as long term trend still strong | Neutral |
The Nifty Smallcap 250 index currently reflects a phase of consolidation within a well-defined range, forming a classic flag pattern. While the short-term indicators such as EMA, RSI, Stochastics, and MACD lean toward a bearish sentiment, the broader trend remains neutral as long as the index holds within its current boundaries. Traders should exercise caution and wait for a clear breakout before taking aggressive positions. A sustained move beyond 17,547 with strong volume could signal the start of a new bullish phase, whereas a breakdown below 16,461 may confirm a deeper correction. Until then, range-bound trading strategies remain more appropriate than trend-following approaches.
Factors Affecting Nifty Smallcap 250
Key factors that affect Indian small-cap stocks include macroeconomic conditions, company fundamentals, liquidity, market sentiment, and the impact of foreign and domestic institutional investors
Since small-cap companies have smaller market capitalizations and fewer resources, they tend to be more sensitive to these factors compared to larger companies, making them highly volatile.
Macroeconomic and Financial Factors
- Economic Strength: Indicators like GDP growth, inflation, and interest rates significantly influence small-cap performance. A strong economic outlook can boost investor confidence, but downturns can cause investors to pull out, leading to steeper declines in small-cap stocks.
- RBI’s Monetary Policy: The Reserve Bank of India (RBI) controls liquidity by setting interest rates. Higher interest rates increase borrowing costs, impacting smaller companies that often rely on bank financing for growth.
- Systemic Liquidity: A persistent liquidity deficit in the financial system, often influenced by the RBI’s actions, can raise borrowing costs and disproportionately affect small-cap firms.
- Corporate Earnings: Weak corporate earnings signals an economic slowdown and can dampen investor sentiment, particularly affecting small-cap stocks.
- Valuation Levels: Extended periods of outperformance can lead to high valuations in the small-cap segment, making them vulnerable to corrections.
- Global Macroeconomic Pressures: Global events like high crude oil prices, which increase import costs and fuel inflation, and weak global demand can affect export-oriented small-cap sectors.
Market Specific Factors
- Liquidity and Volatility: Small-cap stocks often have lower trading volumes, which results in lower liquidity and higher price volatility. This can make it challenging to buy or sell large quantities without impacting the price and means small-cap stocks can see rapid gains or steep losses.
- Analyst and Institutional Coverage: Small-cap stocks receive less attention from institutional investors and financial analysts, which can lead to market inefficiencies and potential undervaluation. This creates opportunities for diligent investors but also means less public information is available.
- Foreign Institutional Investor (FII) Sentiment: FII activity can significantly impact the markets. Negative sentiment and capital outflows by foreign investors can particularly affect small-caps, which are often the first to be trimmed from portfolios during market uncertainty.
- Investor Sentiment: General market sentiment and investor behavior, often influenced by news and economic outlooks, can cause significant short-term movements in small-cap stocks.
Company Specific Factors
- Company Fundamentals: A thorough analysis of a small-cap company’s fundamentals, including its business model, revenue growth, profitability, debt levels, and cash flow, is crucial.
- Management Quality: The competence and trustworthiness of a small-cap company’s management team are vital for its success and long-term vision.
- Competitive Position: A company’s unique product, service, or niche positioning can create a competitive advantage and drive its long-term growth.
- Growth Prospects: Small-cap companies often have significant growth potential because they operate in emerging or niche sectors. However, their future success is not guaranteed.
- Corporate Governance: Ethical management and transparency are essential for small-cap companies, as they can be more vulnerable to regulatory challenges and scandals.
Read More


17020.05
Change: -293.85 points (-1.70%)