

Introduction
The Nifty Midcap 150 index continued to demonstrate resilience during the week ending 8th November 2025, despite minor fluctuations in daily movements. The index opened at 22,073.10 and closed marginally lower at 22,026.40, recording a negligible weekly change of -0.09%, which reflects market stability after weeks of steady gains.
From a trend perspective, the broader market sentiment remains positive across all time frames — short-term (daily), intermediate (weekly), and long-term (monthly) charts continue to show an upward trajectory. This sustained uptrend highlights strong participation from midcap stocks, with investors maintaining confidence in the segment’s growth potential.
As the market heads into the week of 10th to 14th November 2025, the technical structure suggests ongoing strength, though selective consolidation may occur at higher levels. In this analysis, we will examine the technical summary, key patterns, and best stock opportunities within the Nifty Midcap 150 index to identify areas where investors can consider buying on dips or adding quality midcap names for medium-term gains.
Topics of Discussion
Table 1 : Weekly Performance
| Particulars | Value |
|---|---|
| Open | 22073.10 |
| High | 22255.80 |
| Low | 21681.15 |
| Close | 22026.40 |
| Previous Close | 22045.95 |
| Gain | -19.55 |
| Gain % | -0.09 |
Table 2 : Snapshot of Market Trends
| Time frame | Chart used | Trend Direction |
|---|---|---|
| Short Term | Daily | Up |
| Intermediate Term | Weekly | Up |
| Long Term | Monthly | Up |
Technical Analysis of Nifty Midcap 150
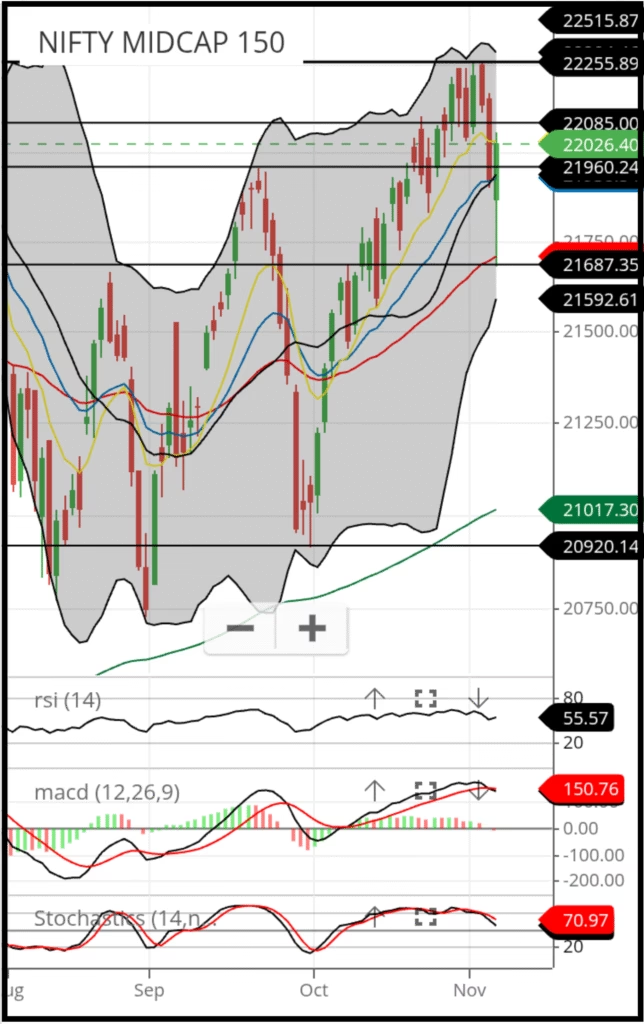
Chart Source : Zerodha Kite
Chart Description
Candlestick Chart
This is a daily candlestick chart of the Nifty Midcap 150 index. Details and how to read the chart is shown in the article below.

Nifty 50 : Prediction for 10th to 14th November 2025 with Factors Affecting it’s Performance
Nifty 50 weekly analysis: After breaking the 25,686 resistance and crossing 26,000, the index faced a short-term pullback to 25,318. While the intermediate and long-term trends remain bullish,...
Read More →Chart Inference:
Chart Pattern Analysis
A closer look at the Nifty Midcap 150 index reveals a continuation of its strong intermediate trend. The index has formed two higher highs and two higher lows, confirming bullish momentum. Throughout October until November 3rd, the index maintained a clear uptrend, showing resilience and steady strength. Minor declines were observed only on November 4th and 6th, which appear to be part of a normal corrective movement rather than a trend reversal.
From July to October, the index developed an inverted shoulder pattern, a formation that often signals a potential upward continuation. However, due to this pattern’s complex structure, drawing a standard trendline could lead to misleading signals. In such cases, using Bollinger Bands provides a more accurate picture of volatility and market behavior.
Bollinger Bands Interpretation
Based on Bollinger Band analysis, the Nifty Midcap 150 index touched a low of 20,920 on October 30th before rebounding to a high of 22,255, nearly reaching the upper band. This movement indicates that the index was temporarily overextended on the upside and due for a mild correction.
Following this, the index retraced to 21,687, coinciding with its 50-day Exponential Moving Average (EMA) level—a key support zone. The quick recovery from that level on the same day reflects strong buying interest and market confidence.
Currently, the index appears to be consolidating within a range of 22,255 (resistance) and 21,687 (support). Given the sustained intermediate uptrend and absence of technical weakness, there remains a high probability of the index breaking above the 22,255 level in the near term, potentially resuming its upward trajectory.
Support & Resistance Commentary
The Nifty Midcap 150 is currently positioned near multiple resistance levels, marked at 22086, 22255, and 22516.
In the near term, the immediate resistance lies at 22086. If the index successfully breaches 22086 on a closing basis, we may expect a further upward move toward the next resistance zone at 22255.
Should the momentum continue and the index manage to sustain above 22255, the next potential upside target becomes 22516.
On the downside, the index has three key support levels placed at 21960, 21687, and 20920.
If Nifty Midcap 150 slips below the support at 21960, the next likely downside test would be the zone around 21687.
A further breakdown below 21687 may drag the index toward the deeper support at 20920, which is expected to act as a stronger cushion unless a major trend reversal takes place.
Table 3 : Supports And Resistances for Nifty Midcap 150
| Support 3 | 20920 |
| Support 2 | 21687 |
| Support 1 | 21960 |
| Closing | 22026.40 |
| Resistance 1 | 22086 |
| Resistance 2 | 22255 |
| Resistance 3 | 22516 |
Interpretation of EMAs (20, 50, 200)
The price is currently above the 20 EMA, indicating a short-term bullish trend.
The price is currently above the 50 EMA, indicating an intermediate-term bullish trend.
The price is currently above the 200 EMA, indicating a long-term bullish trend.
Additionally, the 20 EMA is above the 50 EMA, which confirms a bullish intermediate trend.
The 50 EMA is above the 200 EMA, which confirms a bullish long-term trend.
When all three EMAs are aligned in the same direction (20 > 50 > 200 for bulls or 20 < 50 < 200 for bears), it strengthens the trend and reduces the probability of false signals.
Table 4 : Exponential Moving Averages (EMAs)
| EMA | Value | Comments | Inference |
|---|---|---|---|
| EMA – 10 | 22026 | Coinciding with closing Price | Buy |
| EMA – 20 | 21923 | Below Closing price | Buy |
| EMA – 50 | 21700 | Below Closing price | Buy |
| EMA – 200 | 21017 | Below Closing pricr | Buy |
Interpretation of RSI (14)
The current RSI (14) value is 55.57 Since the RSI is above the 50-level threshold, market momentum currently favors the bulls.
The indicator is in the neutral zone, which suggests a index may continue its uptrend. RSI is also showing signs of positive divergence. Traders should exercise caution and avoid initiating aggressive short positions at this stage. Instead, the preferred strategy is to buy on dips until the indicator confirms a clearer trend.
Interpretation of Stochastics
The current Slow Stochastics value is 70.97 Since the Stochastics is above the 50-level threshold, market momentum currently favors the bulls.
The indicator is in the neutral zone, which suggests a uptrend to continue. Traders should exercise caution and avoid initiating aggressive short positions at this stage. Instead, the preferred strategy is to buy on dips until the indicator cools off and confirms a clearer trend reversal.
Interpretation of MACD
The MACD value is currently 150.76, which is above the zero line. This indicates that the market is presently under the control of the bulls.
But , the MACD line (black) is below the signal line (red), which further confirms a bearish momentum shift. As long as this crossover remains intact, the prevailing uptrend is expected to weaken.
However, if the MACD line begins to converge toward the signal line, traders should be alert for a possible reversal or loss of momentum. A confirmed crossover in the opposite direction would signal a fresh buying opportunity.
Table 5 : Indicators
| Indicator | Value | Comments | Inference |
|---|---|---|---|
| RSI | 55.57 | Neutral with positive Divergence | Buy |
| Stochastics | 70.97 | Just came out of Overbought territory | Sell |
| MACD | 150.76 | Bearish Crossover | Sell |
Key Insights – Overall Technical Summary of Nifty Midcap 150
The technical indicators present a mixed sentiment for the market, but the overall outlook remains bullish with caution.
Bollinger Bands indicate the market is in a neutral to upward phase, showing potential for continued gains.
EMA and RSI both display positive divergence, confirming underlying strength and suggesting that momentum supports a buy-on-dips strategy.
However, Stochastics and MACD show signs of short-term weakness — with Stochastics in negative divergence and MACD forming a bearish crossover, signaling possible consolidation or minor corrections.
Table 6 : Overall Technical Summary
| Object | Comments | Final Verdict |
|---|---|---|
| Bollinger Band | In neutral to up level | Buy |
| EMAs | Positive Divergence | Buy |
| RSI | Positive Divergence | Buy |
| Stochastics | Negative Divergence | Sell |
| MACD | Bearish crossover | Sell |
| Overall Outlook | Trend is Up But it may stay in trading range | Buy in dips |
Final View:
Despite these short-term bearish signals, the broader trend remains upward, and traders can look for buying opportunities on dips rather than aggressive fresh entries at higher levels.
The trend is up but may stay range-bound temporarily. Maintain a bullish bias and consider buying on dips while keeping an eye on short-term momentum indicators.
Stocks To Buy in Nifty Midcap Section
Displaying detailed technical analysis in every post may appear repetitive and cluttered. Therefore, after conducting an in-depth technical and fundamental analysis of the Nifty Midcap 150 stocks, the following five stocks are identified as strong long-term investment opportunities:
- Max Financial Services Ltd
- Suzlon Energy Ltd
- BSE Ltd
- Solar Industries India Ltd
- Dixon Technologies (India) Ltd
These companies have demonstrated consistent performance, solid financials, and growth potential, making them suitable for investors seeking sustained returns over the long term.
Read More


22026.40
Change: -19.55 points (-0.09%)