
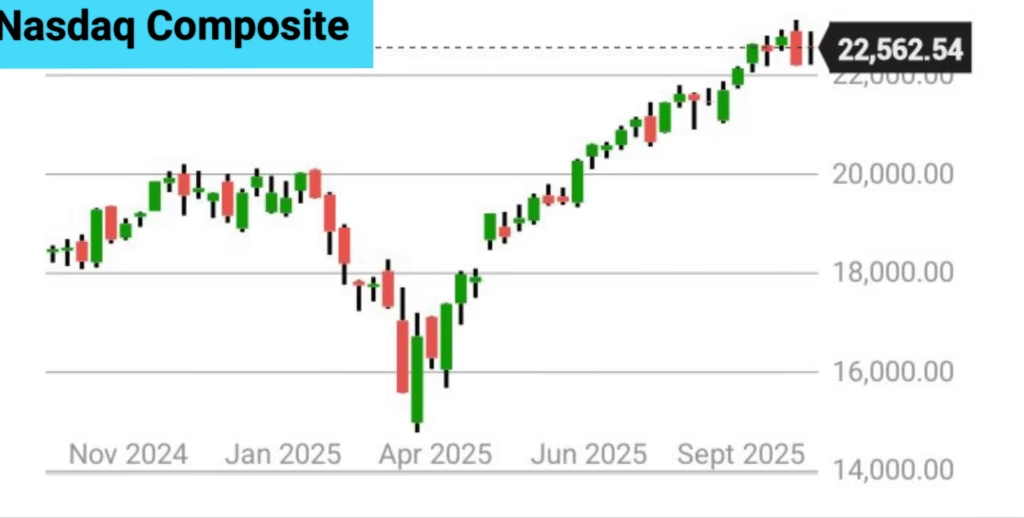
Performance of Nasdaq Composite
The Nasdaq Composite experienced a volatile week, ending with a slight gain overall. Key highlights of the week, ending October 15, 2025, include:
- A notable dip on Friday, October 10, with a -3.56% change, following what appears to have been a day of high volatility.
- A strong rally on Monday, October 13, reversing some of Friday’s losses with a 2.21% gain.
- Mixed, but slightly positive performance in the middle of the week, with a 0.66% gain on Wednesday, October 15, and a 0.47% loss on Thursday, October 16.
- Overall, the index saw significant daily swings but appeared to recover from its mid-week lows.
Understanding the data
- Weekend Recovery: The index saw a significant 3.56% drop on Friday, October 10. However, the market rebounded strongly on Monday, October 13, with a 2.21% gain, demonstrating some resilience in the market after a bad trading day.
- End of Week Gains: Despite the earlier dip, the Nasdaq finished the week on a positive note, with gains reported on both Wednesday and Thursday.
- Mid-Week Volatility: The data points to significant volatility, particularly on October 10, when the difference between the day’s high (23,119.91) and low (22,193.07) was quite large.
Topics of Discussion
A Snapshot of US Stock Market
Here’s a snapshot of how the major indices closed:
| Index | Close | %Change |
| Dow Jones | 45,952.24 | -0.65 |
| Nasdaq | 22,562.54 | -0.47 |
| S&P500 | 6,629.07 | -0.63 |
Technical Analysis of Nasdaq Composite
Here is a technical overview of the Nasdaq Composite based on data up to October 16, 2025. Please note that technical analysis focuses on past price movements to predict future trends.
Resistances and Supports Table
| Close | 22,562.54(-0.47) |
| Resistances | Levels |
| 1 | 22602 |
| 2 | 22650 |
| 3 | 22995 |
| Supports | Levels |
| 1 | 22435 |
| 2 | 22387 |
| 3 | 22327 |
Moving Average Table
| Period (Days) | Simple | Exponential |
| 5 | 25527 | 22547 |
| 10 | 22603 | 23581 |
| 20 | 22645 | 23618 |
| 50 | 22642 | 22667 |
| 100 | 22734 | 23648 |
| 200 | 22712 | 22647 |
Oscillator Table
| Indicator | Vaue | Inference |
| RSI(14) | 45.91 | Neutral |
| Stoch (9,6) | 97.57 | Overbought |
| MACD (12,26) | -36.10 | Sell |
| ADX | 40.56 | Sell |
Insights
Technical Indicators: The current trend is strongly bullish, supported by moving averages, but caution is advised due to overbought conditions indicated by the Stochastic indicators, potentially signaling a short-term correction.
Current Price: 22562.54 as of October 16, 2025.
Key Resistance: Resistance is identified in the 22602 – 22650 area. A break above 22650 could signal further gains towards 22,995.
Key Support: Failure to breach the resistance levels could lead to a decline towards 22435. A break below 22387 would increase selling pressure, potentially pushing the index down to 23327.
Trading Range: The index is currently experiencing an bullish outlook, likely trading within a range of 22435-22650. A breakout from this range is crucial to determine the next significant move.
Analysts and Top Institutional Investors View
On October 16, 2025, analysts and top institutional investors view the Nasdaq Composite with a mixture of continued optimism driven by AI-related technology stocks and growing awareness of potential risks. The index continues to perform strongly, led by tech giants, though concerns exist about market concentration and lingering political and economic uncertainties. Top institutional investors, while active in tech, are also increasingly diversifying into fixed-income instruments, seeking stability.
Analyst and market commentary
- The Nasdaq Composite advanced on October 16, 2025, buoyed by strong corporate earnings from major tech and AI-related companies like Nvidia and TSMC.
- Analysts note the rally is concentrated in a few key AI and tech stocks, raising concerns about market breadth and concentration risk.
- Despite ongoing US-China trade tensions and domestic political uncertainty, positive earnings surprises and demand in the AI sector continue to drive investor focus on growth.
- Technical analysis on October 16 suggests mixed near-term prospects for the Nasdaq, with a key resistance level around 22,830 and support at 22,400. A breakout above resistance could signal further upside, while a break below support could indicate a downturn.
Top institutional investor sentiment
- Institutional investor sentiment shows a significant focus on technology, particularly AI, but a broader market perspective is also emerging.
- In addition to tech, institutional investors are showing increased interest in diversifying towards fixed-income assets, like government and corporate bonds, to lock in yields and hedge against market volatility.
- Some analysts note that recent bullish equity market behavior, including record highs and strong gains, has historical precedent and may suggest further advancement, though agility is recommended.
- The market has also shown signs of broadening risk appetite, with small-cap stocks gaining ground alongside tech leaders, which could signal more stable, broad-based growth.
- The overall sentiment for the Nasdaq remains bullish, with investors seeing pullbacks as opportunities to add capital. However, the market continues to react to both positive earnings and broader geopolitical signals.
Also Read


Factors Affecting the Performance of Nasdaq Composite
The Nasdaq Composite’s performance is primarily affected by the market capitalization-weighted performance of over 3,000 stocks on the Nasdaq exchange, with a heavy influence from its dominant technology sector and top-weighted companies like Apple, Microsoft, and Alphabet. Because of this tech concentration, the index is highly sensitive to technological trends, interest rate changes, and broader economic factors.
Key influencing factors:
- Technology sector performance: The Nasdaq Composite has a significant weighting in the technology sector (over 50%), meaning its performance is directly tied to the health and innovation of this industry. Technological advancements, or setbacks, can cause notable shifts in the index.
- Top company performance: The Nasdaq Composite is market-capitalization-weighted, giving disproportionate influence to a handful of high-value companies. For instance, in early 2024, the top five companies accounted for more than 40% of the index’s weight, amplifying the impact of their individual stock movements.
- Economic indicators: Macroeconomic data such as Gross Domestic Product (GDP), inflation rates, and unemployment can affect investor sentiment and, in turn, stock valuations across the market.
- Interest rates: The Federal Reserve’s decisions on interest rates can heavily influence the Nasdaq. Higher interest rates make borrowing more expensive for companies and can make growth stocks, which dominate the index, less attractive to investors. Conversely, lower rates can fuel investment in growth-oriented tech companies.
- Geopolitical events: Global events like trade disputes, international conflicts, or policy changes can create uncertainty and market volatility, affecting investor confidence and corporate earnings.
- Market sentiment: The overall buying and selling behavior of investors, driven by news, company earnings, and market expectations, can lead to significant fluctuations in the index. This can result in periods of both strong performance and steep downturns, as seen during the 2022 rate hikes and periods of high inflation
Disclaimer
The information provided on this website is for educational and informational purposes only. It should not be considered as financial, investment, or trading advice. The views and analyses expressed are based on publicly available data and personal research and are not recommendations to buy, sell, or hold any securities.
Investing in the stock market and mutual funds involves risks, including the possible loss of principal. Past performance is not indicative of future results. Readers are encouraged to conduct their own research or consult a qualified financial advisor before making any investment decisions.
The website owner and authors shall not be held liable for any direct or indirect losses arising from the use of the information provided here. By using this site, you agree that you are solely responsible for your investment actions.