
US Market performance for the week ending October 10, 2025
Weekly Summary
The US market finished the week ending October 10, 2025, with overall losses across its major indices, erasing earlier gains made during the week. The downturn was primarily triggered by escalating trade tensions with China on Friday, overshadowing optimism driven by artificial intelligence-related stocks earlier in the week.
Topics of Discussion
Performance of Major Indices
Here is a summary of the performance for the major US stock indices during the week:
| Index | Weekly Performance | Friday, Oct 10 | Context |
|---|---|---|---|
| S&P 500 Index | Down 2.4% | Fell 2.71% to close at 6,552.51. This was its worst single-day performance since April. | The S&P 500 had been on track for a weekly gain until the sell-off began midday on Friday. The Information Technology sector was hit hardest, dropping 4%. |
| Dow Jones Industrial Average (DJIA) | Down 2.7% | Fell 1.9% (878.82 points) to close at 45,479.60. It had plunged nearly 900 points during intraday trading. | The Dow finished the week lower, reversing earlier performance, due to the intensifying trade hostilities. |
| NASDAQ Composite Index | Down 2.5% | Fell 3.56% to close at 22,204.43. The index touched an all-time high earlier on Friday before the reversal. | The NASDAQ composite was heavily impacted, particularly by declines in key technology stocks. |
Key Factors on Friday, October 10, 2025
Renewed US-China Trade Tensions
The market reversal on Friday was caused by an announcement from President Donald Trump that he was considering a “massive increase” of tariffs on Chinese imports. This was in retaliation for China’s new restrictions on exporting rare earth minerals, which are crucial for technology and defense industries. The announcement wiped out an estimated $2 trillion in market value.
Escalated “Risk-Off” Sentiment
- Safe-Havens Surge: As investors grew more anxious, demand for safe-haven assets rose. This pushed gold prices to a new record, surpassing $4,000 per ounce.
- Volatility Spikes: The Cboe Volatility Index (VIX), often called Wall Street’s “fear gauge,” jumped significantly, reflecting the heightened investor anxiety.
Performance of Specific Sectors and Stocks
- Technology Sector Hard Hit: Technology stocks, which depend heavily on trade with China, experienced a sharp decline. Notable drops included Nvidia (-5%), AMD (-8%), and Tesla (-5%).
- AI Stock Rally Stalls: Enthusiasm around artificial intelligence stocks earlier in the week, driven by announcements like a partnership between AMD and OpenAI, was completely overshadowed by the Friday sell-off.
- Energy Stocks Fall: Oil prices tumbled as the trade tensions raised concerns about global demand.
- Some Bright Spots: Despite the broad market decline, a few companies performed well. PepsiCo, for instance, saw its stock rise after reporting better-than-expected quarterly results.
Broader Economic Concerns
The negative market sentiment was compounded by other factors, including the ongoing US government shutdown, which entered its 10th day on Friday. This shutdown prevented the release of key government economic data, adding to the uncertainty for investors.
Technical Analysis of Major US Indices
Summary of the Indexes on October 10
On Friday, October 10, 2025, the major US indices—the Dow Jones Industrial Average (DJIA), Nasdaq Composite, and S&P 500—all experienced significant drops, erasing earlier weekly gains and closing out a volatile week with losses.
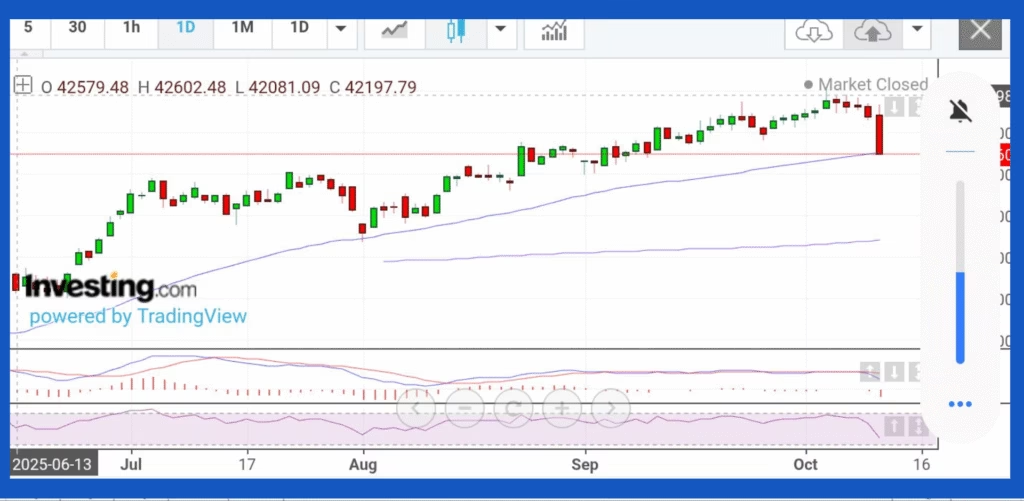
Table of Closing Price
| Index | Symbol | Close |
|---|---|---|
| Dow Jones Industrial Average | .DJI | 45,479.60 |
| Nasdaq Composite | .IXIC | 22,204.43 |
| S&P 500 | .INX | 6,552.51 |
Technical Analysis of the Indexes
Dow Jones Industrial Average (DJIA)
- Momentum Indicators: Technical indicators suggest strong bearish momentum. The Moving Average Convergence Divergence (MACD) was negative, and the Relative Strength Index (RSI) was indicating oversold conditions.
- Support and Resistance Levels: The index broke a short-term support level, giving a negative trading signal. Immediate support is observed around the 45,430 level. If this level fails, the index may test lower support near 45,000.
Nasdaq Composite
- Breaking the Trend: The Nasdaq Composite, heavily influenced by tech stocks, broke below its medium-long term rising trend channel on October 10, indicating a potential slowdown in its upward momentum.
- Support and Resistance Levels: In the medium term, the index now has a support level at 22,100 and resistance at 25,000. The sharp decline suggests a reversal from its previously bullish momentum.
S&P 500
- Channel Breakdown: The S&P 500 also broke through the floor of its rising trend channel in the medium-long term, similar to the Nasdaq.
- Support and Resistance Levels: Support is noted around the 6,480 level, and a failure to hold this level could see a further decline toward 6,300. The RSI is trending downwards, signaling a bearish shift.
- Sector Performance: The sell-off was broad-based, with the tech sector experiencing the heaviest hit. Consumer staples were one of the only sectors to post gains on the day.
Overall market sentiment
The market’s sharp reversal on October 10, 2025, from earlier weekly gains to a significant Friday sell-off indicates a shift in sentiment towards risk aversion. President Trump’s threat of increased tariffs against China created significant uncertainty, causing investors to pull back from riskier assets like tech stocks and move into safer havens like gold. Technical indicators across the major indices reflect this turn towards bearishness.
Also Read :


Macroeconomic Factors and Government Policies Affecting US Stock Market
The US stock market is influenced by a range of macroeconomic factors and government policies that impact investor sentiment, corporate profitability, and market stability.
Key Macroeconomic Factors
- Interest Rates: Changes in interest rates set by the Federal Reserve (the Fed) significantly impact borrowing costs for businesses and consumers. Lower rates encourage borrowing, investing, and spending, potentially boosting stock prices, while higher rates can make borrowing expensive, affecting corporate profits and consumer spending, which can negatively impact stock prices. The Fed uses the federal funds rate to manage overall interest rates.
- Inflation: Inflation, measured by indicators like the Consumer Price Index (CPI), represents the rise in prices for goods and services. While moderate inflation can signal a growing economy, high inflation reduces purchasing power, increases costs for companies, and can prompt the Fed to raise interest rates, potentially leading to lower stock prices and increased market volatility.
- Gross Domestic Product (GDP): GDP measures the total value of goods and services produced in a country. Healthy GDP growth typically boosts investor confidence and corporate earnings, leading to higher stock prices. A contracting GDP can indicate a weakening economy and dampen market performance.
- Unemployment Rate: This indicator reflects the strength of the economy. Falling unemployment rates and rising hiring rates can signal a positive outlook, potentially leading to increased consumer spending and corporate profits, thus boosting the stock market. Conversely, rising unemployment can negatively impact market sentiment.
- Trade Policies/Trade Wars: Imposing tariffs or trade restrictions can disrupt global supply chains, increase costs for businesses, reduce corporate profitability, and create market uncertainty, potentially causing stock prices to fall.
- Industrial Output: Indicators like the Industrial Production Index (IPI) provide insights into the health of the manufacturing, mining, electric, and gas industries. Strong industrial output generally suggests economic growth, while a decline could signal a downturn.
- Retail Sales: As a consumer-driven economy, strong retail sales often lead to positive stock market performance, as increased consumer spending boosts company profits. A decline in retail sales can indicate an economic slowdown and negatively impact the market.
- Global Factors: Global economic conditions, geopolitical events (like conflicts or trade disputes), and the performance of major economies worldwide can also significantly impact the US stock market through channels like investor sentiment, trade flows, and volatility spillovers.
Government Policies
Government policies also significantly impact the stock market.
- Monetary Policy: The Federal Reserve’s management of interest rates and the money supply through the federal funds rate influences borrowing costs and investment.
- Fiscal Policy: Government spending and taxation policies can stimulate or dampen economic growth, affecting corporate profits and market sentiment. A budget deficit can also play a role.
- Regulations: Rules in various industries affect competition, profitability, and stock valuations.
- Trade Policies: Government decisions on trade impact corporate profits, supply chains, and investor confidence.
- Political Stability: A stable political environment promotes investor confidence, while instability creates uncertainty and potential volatility.
Note: These factors are interconnected and complex, requiring investors to consider the broader economic and political landscape.
Also Read


Investor and analyst views on the US stock market across different time frames
As of October 2025, big investors and analysts hold diverse views on the US stock market, considering both immediate risks and long-term potential. While recent volatility due to trade tensions has caused some caution, there is a prevailing bullish sentiment for the longer term, driven by anticipated economic growth, corporate earnings, and technological advancements like AI.
Current and short-term views (next 6 months)
- Volatile and Cautious: The market has experienced recent volatility, notably the sell-off on October 10 due to renewed US-China trade tensions. Concerns exist about the potential for continued volatility, especially surrounding trade policies under the current administration. The ongoing US government shutdown also adds uncertainty.
- Focus on Market Drivers: Analysts are closely watching inflation data, corporate earnings, and central bank policies (specifically potential rate cuts by the Federal Reserve).
- AI Optimism: Despite recent setbacks, the artificial intelligence (AI) boom continues to be a strong theme, with many expecting it to drive growth in tech stocks. However, some analysts question the sustainability of current valuations in AI-driven stocks.
- VIX Indicates Anxiety: The Cboe Volatility Index (VIX) has jumped, reflecting heightened investor anxiety.
- Specific Forecasts:
- Some forecasts suggest the Dow Jones Industrial Average (DJIA) could close 2025 between 46,000 and 48,000.
- J.P. Morgan Research expects the S&P 500 to close near 6,500 by year-end.
Medium-term views (next 12 months / end of 2025)
- Continued Growth Expected: Wall Street analysts generally anticipate continued stock market gains, forecasting strong economic growth, corporate earnings, and a potentially business-friendly administration.
- Bullish on Key Sectors: Institutional investors are bullish on sectors like private equity, tech (especially AI), and stocks in general.
- Diversification Recommended: Given potential market shifts and uncertainties, some experts advise diversification, possibly moving into areas with catch-up potential outside of the dominant tech stocks.
- Potential Challenges: Risks include uncertainty around tariff policy, potential resurgence of inflation, and geopolitical tensions. Some experts point to high US stock market valuations as a concern.
- Specific Forecasts:
- FactSet anticipates the S&P 500 will rise 14.8% in 2025.
- A survey of 15 Wall Street firms arrived at a median S&P 500 value of 6,600 by the end of 2025.
- Goldman Sachs Research has a target of 6,500 for the S&P 500 by the end of 2025, expecting an 11% gain.
- Bank of America projects the S&P 500 will reach 6,666 by the end of 2025.
- Wells Fargo forecasts the S&P 500 will reach 7,007 by the end of 2025.
Long-term views (2026 and beyond)
- Secular Bull Market: Many analysts believe US stocks are in a long-term secular bull market that began after the Global Financial Crisis and could continue for several more years, potentially well into the 2030s.
- Sustained Growth Potential: Projections for the DJIA suggest it could advance beyond the mid-40,000s by 2026, reaching the mid-50,000s by 2028–2029, and potentially 60,000 by 2030.
- AI as a Long-Term Driver: Tech and AI stocks are expected to continue leading growth in the long term, driven by innovation and strong future earnings potential.
- Valuations and Risks: While long-term optimism exists, some institutional investors worry that current valuations do not fully reflect underlying fundamentals. Volatility is expected to remain a factor, favoring active management.
- Cautious Approach on Timing: While the long-term outlook appears positive, analysts emphasize that market timing remains extremely difficult.
Conclusion
Friday, October 10, 2025, highlighted the market’s vulnerability to geopolitical and domestic uncertainties. Renewed US-China trade tensions triggered a sharp market reversal, erasing trillions in market value, while risk-off sentiment drove investors toward safe-haven assets like gold. Technology and energy sectors bore the brunt of the sell-off, and the earlier optimism around AI stocks was completely overshadowed. Although a few companies, such as PepsiCo, managed to buck the trend, the broader market remained under pressure. Compounding these challenges, the ongoing US government shutdown added to investor uncertainty, underscoring how global trade disputes and domestic policy disruptions can swiftly impact market dynamics.
Looking ahead, the coming week is likely to be highly news-driven. Investors should exercise caution and avoid making major financial decisions impulsively. It is advisable to settle existing positions and wait for clearer market signals before initiating new investments.
Disclaimer:
The information provided in this article is for informational and educational purposes only and should not be construed as financial advice. Investing in the stock market involves risk, including the potential loss of principal. Readers should conduct their own research and consult with a licensed financial advisor before making any investment decisions. The author and the website are not responsible for any financial losses incurred based on the content of this article.