
Market Overview
Details for Nifty and Sensex , October 9th, 2025:
- The Nifty 50 opened at 25,074.30 and closed at 25,181.80. It reached a high of 25,199.2 and a low of 25,024.3.
- The Sensex opened at 81,900 and closed at 82172.10. It reached a high of 82,247.73 and a low of 81,667.68.
Topics of Discussion
Key Market Updates for Today
- Both the Sensex and Nifty snapped a winning streak.
- The Nifty managed to hold above the 25,150 level despite closing in the red, while broader markets saw a larger decline compared to the benchmarks.
- Large-cap IT stocks showed some buying interest ahead of upcoming earnings reports, such as TCS.
- Some factors contributing to the market’s activity included Foreign Institutional Investor (FII) buying earlier in the week, strength in IT stocks ahead of TCS results, and global cues like remarks from a Federal Reserve Governor on potential interest rate cuts in the US.
TECHNICAL ANALYSIS
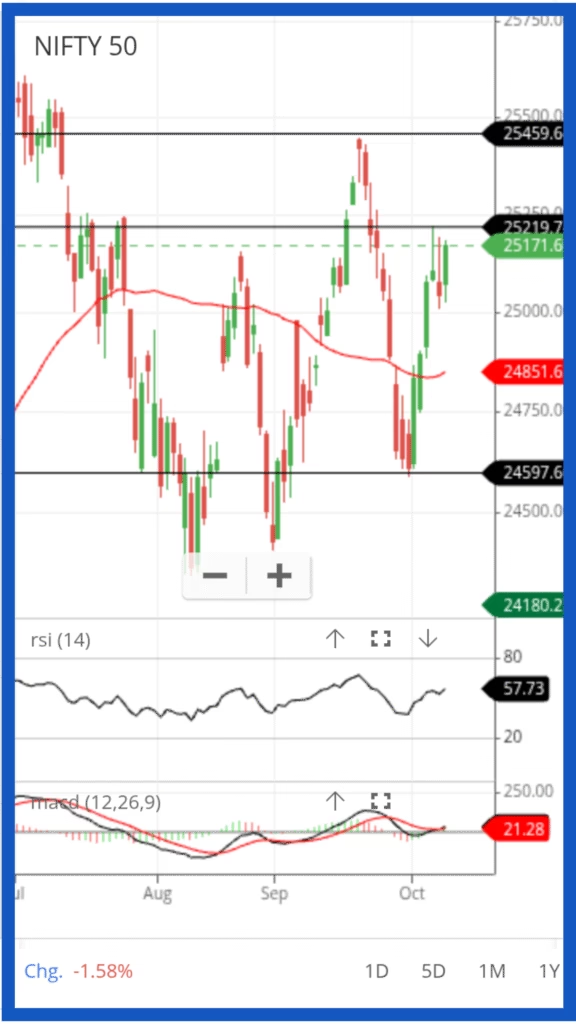
Chart Type & Time Frame
Type: Candlestick chart
Time Frame: 1 Day (each candle represents one trading day)
Index: NIFTY 50
So, each green or red bar (candle) shows the price movement of NIFTY for one day.
Candlesticks
Green candle = Price closed higher than it opened (bullish day).
Red candle = Price closed lower than it opened (bearish day).
The wicks (thin lines) show day’s high and low, while the body shows open and close.
Moving Averages (Red and Green Lines)
You have two moving averages here:
Red line – 50-day moving average (MA50) (medium-term trend).= 24851.6
Green line – 200-day moving average (MA200) (long-term trend) =24180.2
Note: 200 day moving average is below the chart, so it is not visible but it’s value iswritten in green at the right side of the chart in green color.
Interpretation:
Price Above MA50 → Intermediate-term trend is strong.
Price above MA200→ Long-term strength strong.
Crossovers matter:
When red line (MA50) crosses below green (MA200), it’s a bearish crossover (Death Cross).
When red line crosses above green, it’s a bullish crossover (Golden Cross).
Currently, the red MA50 is above the green MA200, but price is fluctuating near it, indicating strength.
Support and Resistance Levels
The black horizontal lines are key support/resistance zones:
Level Type Meaning
25459 Resistance Strong supply zone – price previously fell from here.
25219 Resistance Near-term hurdle; price struggling to cross this.
24597 Support Buyers have defended this level before.
24174 Major Support Long-term floor; if broken, could trigger a deeper correction.
Currently, price is around 25181, just below resistance (25219) — so there’s selling pressure near that area.
RSI (Relative Strength Index – middle panel)
Indicator below the main chart.
RSI = 57.78 (neutral zone).
Range meaning:
Above 70 = Overbought → Possible correction.
Below 30 = Oversold → Possible bounce.
Around 50 = Neutral → Consolidation or sideways market.
👉 Interpretation: Nifty is neither overbought nor oversold. Momentum is balanced.
MACD (Moving Average Convergence Divergence – bottom panel)
Two lines (black and red) and histogram bars.
Black line = MACD line
Red line = Signal line
Reading:
MACD > Signal line → Bullish momentum.
MACD < Signal line → Bearish momentum.
Histogram (green/red bars) shows momentum strength.
Currently, both lines are very close — momentum is gaining strength as crossover is observed.
🔎 7. Overall Technical View
Aspect Observation Meaning
Price vs MA50 Slightly bullish
RSI Neutral (57.78) Sideways momentum
MACD Flat, near zero gaining momentum
Key Support 24597 If broken → deeper fall possible
Key Resistance 25219 Needs breakout for bullish confirmation
In Simple Words
Nifty 50 is currently trapped between 24600 (support) and 25200 (resistance).
RSI and MACD both show neutral momentum — no strong trend.
If Nifty closes above 25219, it could target 25459+.
If it breaks below 24597, it could test 24174.
Insights from the Chart (Bullish Bias):
Despite recent volatility, the Nifty 50 is showing early signs of regaining strength. The index has successfully held above the crucial 24,600 support zone and is now attempting to reclaim the 25,219 mark. RSI remains comfortably above the midpoint at 57, indicating that buying momentum is gradually building without entering overbought territory. The MACD, though still flat, is on the verge of a positive crossover — a sign that bullish momentum could soon pick up.
If Nifty manages a decisive close above 25,219, it would confirm a short-term breakout, opening the path toward 25,460–25,500 levels. The overall structure suggests a base formation near 24,600, and as long as this support holds, the broader trend remains positive. Dips toward the 24,800–24,850 range can be seen as healthy retracements and potential buying opportunities for medium-term investors.
Also Read

Key Factors Affecting Nifty 50 Performance
The performance of the Nifty 50 is shaped by a complex mix of influences — including economic indicators, government actions, global events, and market-specific dynamics. Each of these factors plays a crucial role in determining how the index moves over time.
Economic Indicators
Government Policies & Regulations
Monetary Policy (RBI)
Decisions made by the Reserve Bank of India (RBI) on key interest rates—such as the Repo and Reverse Repo rates—and overall liquidity management directly affect borrowing costs for companies. These choices also influence how much money flows into the market, thereby impacting stock performance.
Fiscal Policies & Budget Announcements
Government policies related to taxation, regulation, and public spending can significantly affect corporate profitability, investor sentiment, and sectoral growth. Budget announcements often trigger immediate market reactions, depending on how business-friendly the measures appear.
Regulatory Policies (SEBI)
Changes in trading, disclosure, and investment norms introduced by SEBI can influence how investors operate and, in turn, impact stock prices and market behavior.
Global Factors.
Geopolitical Events
Events such as international conflicts, trade tensions (like U.S. tariff policies), or global economic crises can introduce uncertainty, affecting both investor sentiment and capital flows into emerging markets like India.
Crude Oil Prices
Volatility in crude oil prices directly impacts sectors dependent on imports, influencing corporate margins and stock valuations. Some research points to a positive effect during periods of global economic recovery, while others highlight a negative impact due to rising inflation pressures.
Foreign Institutional Investment (FII) Flows
Foreign capital inflows tend to boost demand and push stock prices higher, while significant outflows create selling pressure and market weakness. FII movements are among the most closely watched indicators of short-term market direction.
Market Dynamics
Corporate Earnings & Performance
Strong quarterly earnings from Nifty 50 companies usually lift stock prices, while weak or disappointing results tend to trigger sell-offs and declines.
Investor Sentiment
Investor mood—driven by news, rumors, or analyst reports—plays a major role in market volatility. Even small changes in sentiment can lead to sharp price swings.
Sector Performance
Trends within specific industries, such as IT, Banking, or Automotive, can heavily influence the overall index. A rally in one major sector can often offset weakness in another.
Supply and Demand Dynamics.
The age-old economic principle applies:
When demand exceeds supply, prices rise; when supply outweighs demand, prices fall. Large institutional trades can significantly disturb this balance and move the market sharply in either direction.
Recent Influences on the Nifty 50
Recently, the Nifty 50 experienced a downturn due to profit-taking, weak global cues, and pressure from the banking and real estate sectors.
However, IT stocks showed resilience, supported by robust demand and attractive valuations. Investors are now watching upcoming earnings reports, particularly from companies like TCS, for direction.
Meanwhile, higher U.S. bond yields and a stronger U.S. dollar have triggered sustained FII selling in Indian equities.
Despite these challenges, domestic fundamentals remain strong—driven by steady consumption, RBI policy support, and ongoing government initiatives that continue to attract long-term investors.
Predictions of Other Analysts
Predictions for the Nifty 50 differ across time horizons, reflecting a mix of technical, fundamental, and institutional analyses.
In the long run, the outlook for the Nifty 50 remains broadly positive, underpinned by India’s robust economic growth, a young population, an expanding middle class, and continued digital transformation.
Long Term Outlook:
Growth is expected from sectors such as technology, manufacturing, infrastructure, and financial services. Government reforms, foreign investment, and structural improvements in these areas will likely sustain long-term momentum.
Potential Targets
Analysts have proposed varying targets:
Some projections place the Nifty between 90,000–100,000 by 2030.
Others forecast a more conservative target of around 60,000 by 2033.
Intermediate Term Outlook
As the economy evolves, the composition of the Nifty 50 is expected to shift. Emerging industries like advanced technology and digital services may join the index, while traditional sectors such as banking, energy, and IT could see consolidation.
Intermediate-Term Outlook (3–6 Months)
Axis Securities
Forecasts the Nifty 50 to reach 25,500 by March 2026.
JPMorgan
Projects the index to trade between 26,500 and 30,000 over the next nine months.
Motilal Oswal
Maintains a 26,000 target for March 2026.
Contrarian Indicator (FII Positioning)
Current data suggests that if Foreign Institutional Investors (FIIs) maintain near-peak short positions in index futures, the Nifty could see a 6–8% rebound over the next three to six months.
Centrum Broking Ltd
Predicts a rally toward 25,500 during the October series, provided the index holds above 25,020.
Hedged.in
Observes a bullish trend, noting that the Nifty recently closed above the Bollinger Band middle line, indicating potential movement toward 25,330.
Short-Term Outlook
(Today, Tomorrow, This Week)
Latest Closing (October 9, 2025)
The Nifty 50 last closed at 25181.80
Today’s Outlook (October 10, 2025)
The immediate bias remains positive, with room for short-term consolidation.
Key Levels
Support: 25,000 remains a strong support zone. This level is a strong psychological support.
Resistance: Immediate resistance lies 25,219.
Market Action
Sustained trading above 25,000 could unlock fresh upside potential toward 25,200–25,300.
Analysts recommend buying on dips, especially near 24,600, while avoiding short positions above 25,000.
Disclaimer
The information shared on Smart Investello Research and Analysis (SIRA) is intended solely for educational and informational purposes. All articles, charts, analyses, and calculators published here reflect research-backed insights and personal opinions aimed at improving financial awareness among readers.
SIRA does not provide personalized investment advice or recommend buying, selling, or holding any particular stock, mutual fund, or financial instrument. The content is designed to help readers understand Systematic Investment Plans (SIPs), mutual funds, and stock market trends more effectively, not to serve as a substitute for professional financial consultation.
Investing in equity, mutual funds, or any market-linked product involves market risks, including potential loss of capital. Readers are strongly advised to verify all information independently and consult a SEBI-registered financial advisor before making any investment decisions.
SIRA and its authors will not be liable for any financial loss, damage, or inconvenience arising directly or indirectly from the use of the information provided on this website.