

Introduction
Systematic Investment Plans (SIPs) have witnessed remarkable growth in India, becoming one of the most preferred methods for long-term investing. By November 2025, monthly SIP inflows crossed ₹29,000 crore, reflecting a strong shift toward disciplined and market-linked investment strategies.
Today, more than 6 crore active SIP accounts highlight the growing trust among retail investors. With investment options starting as low as ₹500, SIPs have made equity investing accessible while helping investors manage market volatility through rupee cost averaging and long-term wealth creation.
Topics of Discussion
Key Drivers Behind SIP Growth
High Monthly Inflows
SIP contributions reached an all-time high of around ₹29,445 crore by November 2025, showing a sharp rise compared to previous years.
Record New Registrations
In April 2024 alone, over 63 lakh new SIP accounts were added, indicating rapid adoption among new investors.
Strong Retail Participation
With more than 6 crore active accounts, SIPs have become a trusted investment route for small and medium investors.
Attractive Long-Term Returns
Historically, SIPs have delivered around 12–15% returns over 10–15 years, outperforming traditional options like Fixed Deposits.
Factors Powering SIP Popularity
Rupee Cost Averaging
SIPs automatically buy more units when prices are low and fewer when prices are high, removing the need to time the market.
Disciplined Investing
Regular and automated investments help investors stay consistent, even with small monthly contributions.
Technology-Driven Simplicity
User-friendly apps, robo-advisors, and digital platforms have made investing easier than ever.
Awareness and Trust
Investor awareness campaigns like Mutual Funds Sahi Hai and better regulations have boosted confidence in mutual funds.
Growth Trends in SIP Investing
Rapid AUM Expansion
SIPs now contribute a significant portion of total mutual fund Assets Under Management (AUM), showing their increasing importance.
Long-Term Investment Mindset
More investors are focusing on 5–10 year horizons to benefit from compounding.
Increased Accessibility
Initiatives like micro-SIPs (₹250 “Chhoti SIP”) have brought investing within reach of a wider population.
For New Investors
What is a Systematic Investment Plan (SIP)?
A SIP is a method of investing a fixed amount regularly (usually monthly) in a mutual fund.
Example:
If you invest ₹1,000 every month in a mutual fund, you will buy more units when prices are low and fewer units when prices are high. Over time, this reduces your average cost.
What is Lump Sum Investment?
A lump sum investment means investing a large amount of money at one time.
Example:
If you invest ₹1,20,000 at once in a mutual fund, your entire investment depends on the market level at that moment.
SIP vs Lump Sum Investment
SIP vs Lumpsum Investment
| Feature | SIP | Lumpsum |
| Investment Style | Regular (Monthly) | One Time |
| Risk Level | Lower ( Averaging Effect) | Higher (Timing Risk) |
| Market Timing | Not Required | Important |
| Suitable For | Salaried / Regular Investors | Investors with Surplus Funds |
How Much Wealth Can a SIP Investor Create?
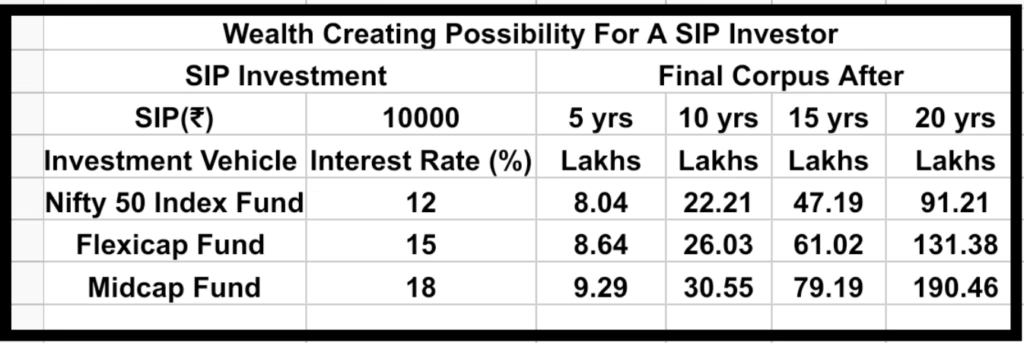
The table above demonstrates the long-term wealth creation potential of a SIP with a fixed monthly investment of ₹10,000 across different types of mutual funds.
Key Assumptions
- Monthly SIP Amount: ₹10,000
- Investment Duration: 5, 10, 15, and 20 years
- Return Expectations:
- Nifty 50 Index Fund: 12%
- Flexicap Fund: 15%
- Midcap Fund: 18%
These return rates are indicative of long-term historical averages and help illustrate the impact of compounding.
What the Table Shows
- Power of Time in the Market
Even with the same monthly investment:
After 5 years, the corpus is relatively modest
But by 20 years, the wealth grows exponentially
For example:
At 12% return, ₹10,000 SIP grows to around ₹91 lakh in 20 years
At 15%, it becomes ₹1.31 crore
At 18%, it can reach nearly ₹1.90 crore
👉 This clearly shows that time is the biggest driver of wealth creation
- Impact of Higher Returns
A small difference in return creates a huge difference over time:
Difference between 12% and 15% → nearly ₹40 lakh extra in 20 years
Difference between 12% and 18% → almost double the wealth
This highlights:
✔ Importance of fund selection
✔ Role of equity exposure in long-term investing
- Compounding at Work
In the early years:
Growth appears slow
Most of the corpus comes from your contributions
But in later years:
Returns start generating returns
Wealth accelerates rapidly
👉 This is the power of compounding
- Consistency Beats Timing
The table assumes:
✔ No market timing
✔ No lump sum investing
✔ Only disciplined monthly SIP
Yet, it still creates significant wealth.
This proves:
👉 You don’t need perfect timing — you need consistency
Simple Interpretation
- Small monthly investment → Big long-term wealth
- Time + Discipline → Powerful results
- Higher return → Exponential difference
Final Insight
- A SIP is not just a saving habit — it is a wealth-building strategy.
- Even a moderate monthly investment, when continued for the long term, can create substantial financial assets.
- 👉 The earlier you start and the longer you stay invested, the greater the benefit.
SIP Works in Every Market — Here’s How
Many investors believe SIP (Systematic Investment Plan) works best only when markets fall.
They are partly right.
Most people understand these two benefits of SIP:
- In a flat market, SIP helps you accumulate more units.
- In a bear market, SIP helps you buy at cheaper prices.
But a common question arises:
Does a bull market provide any opportunity for SIP investors?
Yes — and this is where patience rewards disciplined investors.
Opportunity in a Flat Market
When markets move sideways for months or even years, many investors feel frustrated because their portfolio does not grow much.
But SIP investors benefit quietly.
Since prices keep moving up and down within a range:
- Your fixed monthly investment buys units at different prices.
- More units are purchased when prices dip.
Over time, this leads to strong unit accumulation.
So even though the portfolio value may look slow in growth, your future potential improves.
Flat markets are actually unit-building phases.
Understanding the Flat Market Phase (1992–2004)
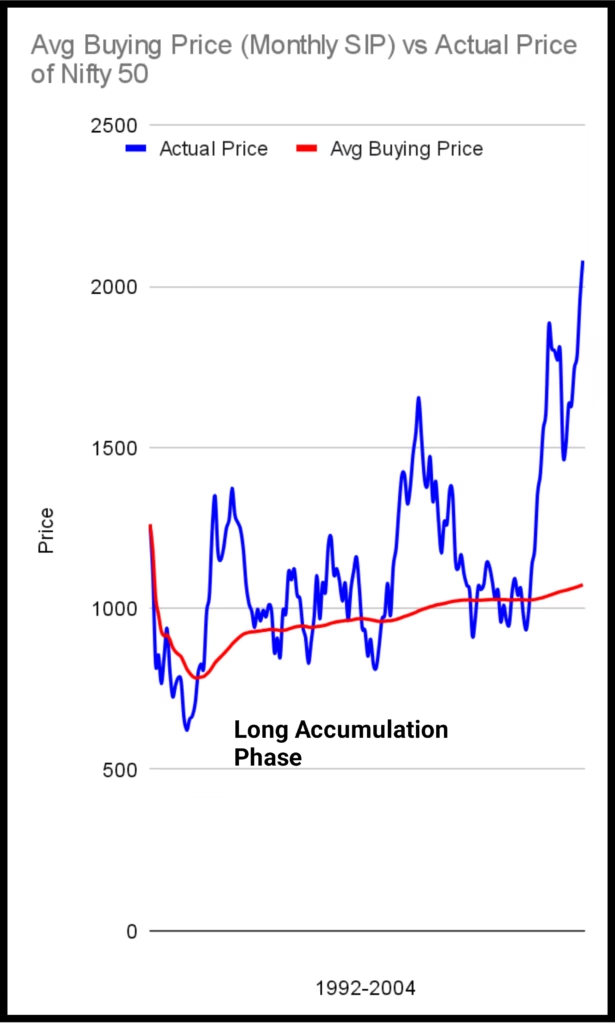
The above graph of Nifty 50 from 1992 to 2004 clearly shows a long sideways or flat market phase.
What the Graph Shows
The blue line (Actual Price) moves up and down frequently
But over a long period, it does not show a strong upward trend
This creates a range-bound market where prices fluctuate but do not grow significantly
This is what we call a long accumulation phase.
How SIP Works in This Phase
The red line (Average Buying Price) behaves very differently:
It remains relatively stable and smooth
It increases slowly over time
It stays well below many of the short-term price peaks
This happens because:
✔ SIP keeps investing at regular intervals
✔ More units are bought when prices fall
✔ Fewer units are bought when prices rise
The Hidden Advantage
During this 12-year flat phase:
Investors may feel that “nothing is happening”
But in reality, they are accumulating a large number of units at reasonable prices
This is the most important insight:
👉 Flat markets do not build wealth immediately — they build the foundation for future wealth.
What Happens Next?
At the end of such accumulation phases:
When the market finally breaks out into a bull run
The large number of accumulated units starts growing rapidly in value
This is when SIP investors see real wealth creation
Simple Interpretation
Flat market = Low excitement + High opportunity
Even though prices appear stagnant, disciplined SIP investors are:
✔ Building quantity
✔ Controlling average cost
✔ Preparing for the next growth phase
Opportunity in a Bear Market
Bear markets are emotionally difficult.
Markets fall sharply. News becomes negative. Fear spreads.
But for SIP investors:
- The same monthly investment now buys units at much lower prices.
- This reduces the average buying cost.
This is called cost averaging.
In simple words:
You buy more when markets are cheap without trying to time the market.
Bear markets are discount seasons for SIP investors.
Understanding the Bear Market Opportunity (2008–2013)
The above graph of the Nifty Midcap 150 Momentum 50 highlights how SIP behaves during a severe bear market, particularly around the Global Financial Crisis.
What the Graph Shows
The blue line (Actual Price) falls sharply during the crisis
The market drops from around 4000 levels to nearly 1239 (lowest closing price)
This period represents extreme fear, uncertainty, and negative sentiment
However, the most important observation is not the fall — but what happens alongside it.
How SIP Reacts Differently
The red line (Average Buying Price) behaves in a controlled manner:
It declines gradually, not sharply
It stabilizes much above the lowest market point
It reaches a break-even level around 1830
This shows that:
✔ SIP does not try to catch the bottom
✔ Instead, it keeps investing consistently
✔ It spreads purchases across falling prices
The Power of Cost Averaging
During this falling phase:
More units are bought at lower prices
Fewer units were bought earlier at higher prices
This automatically reduces the overall cost.
👉 This is cost averaging in action
Even though the market touched 1239, the investor’s average cost stayed around 1830 — much higher than the bottom, yet significantly lower than initial levels.
The Hidden Advantage
The key insight is:
👉 You don’t need to buy at the lowest price to benefit
By simply continuing SIP:
Investors avoid emotional decisions
They accumulate units at progressively cheaper prices
They position themselves for recovery
What Happens After the Fall?
Once the market starts recovering:
The actual price (blue line) rises quickly
It crosses the average cost (red line) at the break-even point
After that, the portfolio moves into profit
This transition happens faster than most investors expect
Simple Interpretation
Bear market = Fear for traders, Opportunity for SIP investors
Even during deep market crashes:
✔ SIP reduces average cost
✔ Builds large unit base
✔ Prepares for strong recovery
This graph proves a powerful point:
👉 Bear markets are not losses — they are preparation phases for future gains
But What About Bull Markets?
This is where many people get confused.
When markets rise sharply:
- Prices are high
- New SIP investments are made at higher levels
So some investors worry:
“Will my average cost increase too much?”
The answer depends on one thing — how long you have stayed invested.
The Magic Happens After 36 Months of SIP
If you run SIP consistently for about 3 years (36 months):
You would have already invested through:
- Lower markets
- Average markets
- Possibly some falling phases
By now:
✔ Your average buying cost becomes stable
✔ You have accumulated a significant number of units
Now when a bull market begins, prices start rising rapidly.
Your SIP continues — but something important changes.
The fresh monthly SIP becomes small compared to the total amount already invested.
So even though:
➡ New purchases are happening at higher prices
They do not significantly increase your overall average cost.
The Hidden Bull Market Advantage
At this stage, your earlier investments — made at lower prices — start acting like:
👉 A large lump sum invested cheaply in the past.
Now as markets rise:
- The value of previously accumulated units grows sharply
- Your overall average cost remains largely unchanged
This means:
You fully participate in the bull run
Without damaging your cost efficiency
Bull markets become wealth expansion phases.
Understanding the Bull Market Advantage (2018–2025)
The above graph of the Nifty Midcap 150 Momentum 50 clearly demonstrates how SIP behaves during a strong bull market phase, especially after the initial investment period.
What the Graph Shows
The blue line (Actual Price) rises sharply after 2020
This rally begins after the sharp fall during the COVID-19 Pandemic
From 2020 onwards, the market enters a powerful upward trend
At the same time:
The red line (Average Buying Price) increases slowly and steadily
It does not rise sharply despite the strong bull run
The Role of the First 36 Months
The graph highlights an important phase:
👉 First 36 Months (Accumulation Period)
During this period:
Investments are made across different market levels
Units are accumulated at relatively lower and average prices
The average cost is built gradually
This phase acts as the foundation of your portfolio.
What Changes After 36 Months?
After this accumulation phase:
The total invested amount becomes large
The number of units held is significant
Now when the market rises sharply:
✔ The impact of new SIP investments becomes smaller
✔ Even though new units are bought at higher prices
✔ They do not significantly increase the overall average cost
The Key Insight from the Graph
Despite the strong rally:
The market price (blue line) moves far above
The average cost (red line) remains much lower and stable
This creates a wide gap between:
👉 Market value and purchase cost
Which directly translates into:
📈 Strong portfolio gains
The Hidden Power of SIP in Bull Markets
This graph proves an important principle:
👉 Wealth is created not just by investing during a bull run, but by being prepared before the bull run begins
Because:
Earlier investments were made at lower prices
Those units now grow rapidly in value
The average cost remains controlled
Simple Interpretation
Bull market = Reward phase for disciplined SIP investors
✔ Accumulated units start compounding
✔ Average cost remains stable
✔ Wealth grows तेजी से (rapidly)
This leads to a powerful conclusion:
👉 SIP investors don’t chase bull markets — they benefit from them automatically
Understanding SIP Across Market Cycles
Let’s simplify the role of SIP in each phase:
Each phase plays a different role.
SIP Advantage at Different Market Cycles
| Market Conditions | SIP Advantage |
| Flat or Sideways Market | Accumulate More Units |
| Bear Market | Buy At Cheaper Prices |
| Bull Market (After 3+ Years) | Grow Wealth Without Major Rise in Average Buying Cost |
- Flat market builds quantity
- Bear market improves cost
- Bull market builds wealth
The Real Lesson
SIP is not about predicting markets.
It is about:
✔ Staying invested
✔ Accumulating steadily
✔ Allowing time to work
When investors remain patient and disciplined:
Every market condition becomes useful.
Flat markets help accumulation
Bear markets offer discounts
Bull markets create growth
Final Thought
SIP does not need the “right market”.
It only needs the right mindset.
Because for disciplined investors:
👉 Every market — flat, falling, or rising — provides an opportunity.
All it takes is patience and consistency.
SIP Investing Recommendations for 2026
For investors seeking stability along with consistent long-term growth, fund selection plays a crucial role. The following funds stand out for their strong downside protection, while also delivering returns that are above their respective benchmarks and category averages. This balance makes them suitable candidates for disciplined SIP investing in 2026.
Recommended Funds for SIP
Parag Parikh Flexicap Fund
Known for its value-oriented approach and global diversification, this fund has demonstrated resilience during market downturns while maintaining competitive long-term returns.
HDFC Flexicap Fund
With a well-diversified portfolio across market capitalizations, this fund combines stability with growth potential, making it suitable for long-term SIP investors.
SBI Focused Equity Fund
This concentrated portfolio strategy focuses on high-conviction stocks, offering strong performance with relatively better downside management.
Kotak Midcap Fund
For investors looking to participate in midcap growth with controlled risk, this fund has shown the ability to outperform while maintaining reasonable volatility.
ICICI Prudential ELSS Tax Saver Fund
Along with tax-saving benefits under Section 80C, this fund has delivered consistent performance with effective risk management.
These funds collectively offer a combination of capital protection during market declines and the potential for superior long-term returns — making them well-suited for SIP investors aiming to build wealth steadily in 2026 and beyond.
Frequently Asked Questions (FAQs)
Is SIP useful in a bull market?
Yes. After running SIP for a few years, most of your investment is already made at lower prices. During a bull market, the value of these accumulated units rises sharply without significantly increasing your average cost.
2. Why is a flat market good for SIP investors?
In a flat market, prices move up and down within a range. This allows SIP investors to accumulate more units over time, which helps in future wealth creation.
3. How does SIP benefit during a bear market?
During a bear market, SIP buys more units at lower prices. This reduces the average cost of investment and improves long-term returns.
4. When does SIP benefit most from a bull market?
After about 36 months of consistent SIP, the total accumulated investment becomes large. At this stage, rising markets increase wealth rapidly without raising the average cost significantly.
5. Does SIP require market timing?
No. SIP works on disciplined investing rather than market timing. It automatically takes advantage of market ups and downs.
6. What is the biggest advantage of staying invested through SIP?
The biggest advantage is that SIP provides opportunity in every market condition — flat, falling, or rising — helping investors build wealth over time through patience and consistency.