
Introduction: Breakout Stocks in an Uptrend
Breakout stocks are those that move above a key resistance level or trading range with strong volume and momentum, signaling the start of a new upward phase. Such moves often indicate a shift in market sentiment from consolidation to renewed buying interest.
When a breakout occurs in alignment with the long-term uptrend, it carries even more strength and reliability. In these cases, the breakout is not just a short-term spike but a continuation of a broader bullish trend, suggesting that prices are likely to sustain at higher levels.
Currently, Tata Steel, JSW Steel, and Hindalco Industries are all showing weekly breakout patterns while forming an uptrending channel. This indicates steady accumulation and strong buying momentum across the metal sector. These breakouts, supported by rising volumes and positive sectoral sentiment, reinforce the potential for further upside as long as the long-term trend remains intact.
When breakouts occur within a sustained uptrend, they tend to be more durable, offering investors higher conviction for medium- to long-term gains.
Topics of Discussion
Nifty 50 Break Out Stock 1 : Tata Steel Ltd
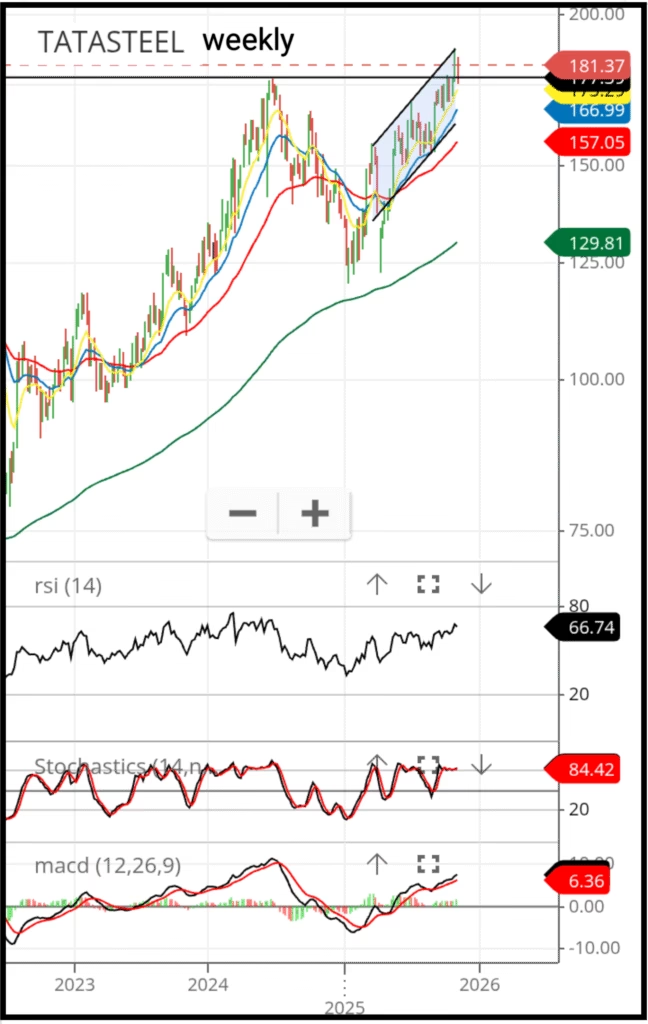
Chart Source – Zerodha Kite
Chart Pattern Analysis
Tata Steel has initiated its upward journey from January 2025. Before entering a sustained uptrend, the stock formed an inverted head and shoulders pattern, a classic bullish reversal signal that indicates underlying strength and accumulation. Following the completion of this pattern, Tata Steel has been moving within an upward-sloping channel, as illustrated in the chart. The breakout occurred during the week ending 31st October 2025, confirming the start of a fresh bullish phase within its long-term trend.
Company Details
Founded: 1907 — Asia’s first integrated private steel company. Operates across the full steel value chain from mining to finished products. Targeted domestic steelmaking capacity: 30 MnTPA by 2025.
Products & Brands
Manufactures both flat and long steel products — HR/CR coils, galvanised steel, wire rods, rebars, tubes, bearings, ferro alloys, wires, etc. Products are sold under 20+ brands including Tata Tiscon, Tata Steelium, Tata Astrum, Tata Structura, Tata Wiron, and others.
Key Metrics (FY23 → FY25)
Production
30.65 → 30.92 Mn T
Deliveries
28.79 → 30.96 Mn T
Calculated Realisation
₹79,213 → ₹65,563 per ton
EBITDA / ton
₹11,358 → ₹8,441
Geographical Split
- India: 54% → 58% (FY23 → FY25)
- Outside India: 46% → 42% (FY23 → FY25)
Manufacturing Footprint
India operations include five plants in Jharkhand and Odisha with a combined capacity of 26.6 MnTPA. International operations (UK, Netherlands, Thailand) add 8.7 MnTPA, taking consolidated capacity to ~35 MnTPA.
- Tube capacity: 1.65 MnTPA
- Steel wire: 0.6 MnTPA
- DI pipe: 600 KT
- Bearings: 40 million units
Capacity Expansion
India capacity target: 40 MnTPA. Recent and planned additions include a 5 MnTPA blast furnace at Kalinganagar, phased commissioning of a 2.2 MnTPA CRM complex, 0.8 MnTPA Ludhiana expansion (by FY27) and 0.5 MnTPA finishing capacity in Jamshedpur (early FY26). Capex in FY25: ₹15,671 Cr.
Sustainability & Decarbonisation
UK: transitioning to a 3.2 MnTPA EAF-based route targeted by FY28 (project cost ~£1.25bn with a £500m grant). Netherlands: plan to replace blast furnaces with a DRI + EAF route to move toward green steel by 2030 and thereafter.
Mining Operations
Captive coal and iron ore mines in India (Jharia, West Bokaro, Noamundi, Joda East, etc.) and iron ore assets in Canada. Many legacy low-cost captive mines expire by 2030; the company is bidding for additional mines and plans strategic bids when auctions occur.
New Product Development
In FY25 Tata Steel developed 123 new products, including advanced steels like CP780 and supplies of DP780 for automotive lightweighting, plus X65H line pipe steel for hydrogen transport.
Acquisition
Acquired equity shares of T Steel Holdings Pte. Ltd. in FY25 for an aggregate consideration of USD 2.875 billion (≈ ₹24,530 Cr).
Focus & Guidance (FY26)
- Planned capex: ₹15,000 Cr (≈75% in India).
- Cost-saving target: ₹11,500 Cr in FY26 (₹4,000 Cr expected from India operations).
- UK fixed-cost reduction goal: £995m → £540m by FY26.
- Netherlands target: €500m savings via volume and operational improvements.
Nifty 50 Break Out Stock 2 : Hindalco Industries Ltd
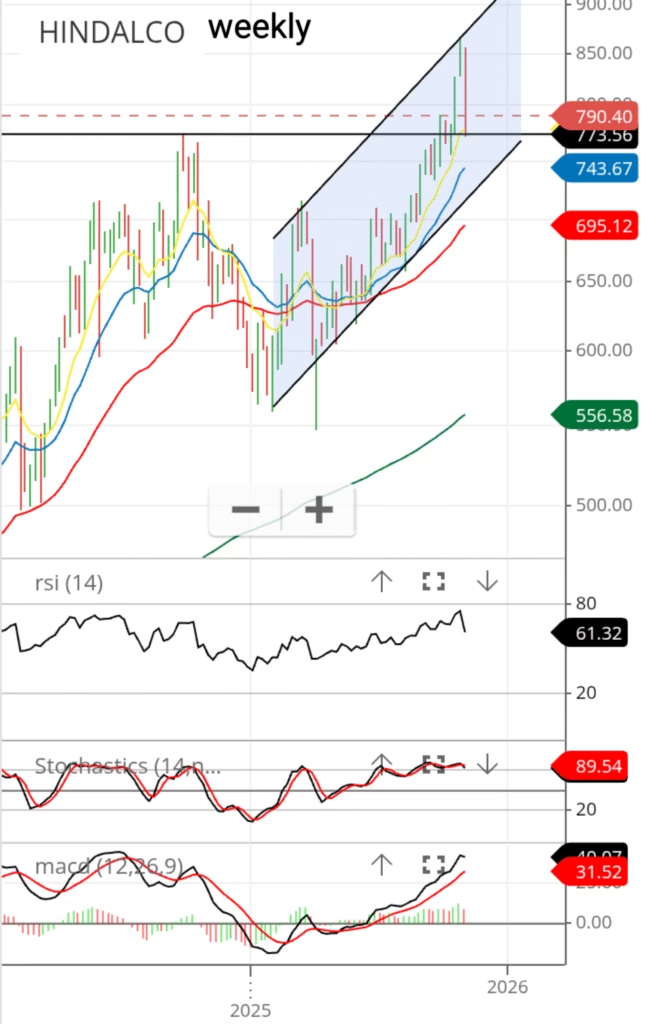
Chart Pattern Analysis
Hindalco Inds has initiated its upward journey from January 2025. Before entering a sustained uptrend, the stock formed an inverted head and shoulders pattern, a classic bullish reversal signal that indicates underlying strength and accumulation. Following the completion of this pattern, Hindalco Inds has been moving within an upward-sloping channel, as illustrated in the chart. The breakout occurred during the week ending 26th September 2025, confirming the start of a fresh bullish phase within its long-term trend.
Company Details
Incorporated in 1958, Hindalco Industries Ltd. is the flagship company of the Aditya Birla Group. The company and its subsidiaries are primarily engaged in the production of Aluminium and Copper. It also manufactures aluminium sheet, extrusion, and light gauge products used in packaging markets like beverage and food cans, and foil products.
Business Segments
1) Novelis (59% in 9M FY25 vs 65% in FY22):
Novelis, a subsidiary of Hindalco, is the leading producer of flat-rolled aluminum products and the world’s largest recycler of aluminum. It serves diverse industries including beverage cans, automobiles, aerospace, and specialty markets such as foil packaging and transportation products.
Total Shipment: 2,800 KT in 9M FY25 vs 2,722 KT in 9M FY24
- Can: 60%
- Automotive: 19%
- Specialities: 18%
- Aerospace: 3%
2) Copper (23% in 9M FY25 vs 19% in FY22):
The company produces copper cathodes and continuous cast copper rods for industries like automotive, consumer durables, and electrical equipment. It is one of the largest manufacturers of copper cathode rods (excluding China) and operates one of Asia’s largest custom copper smelters at a single location in Dahej, Gujarat.
Sales (KT):
Metal: 356 (9M FY25) vs 371 (9M FY24)
CC Rods: 285 (9M FY25) vs 291 (9M FY24)
3) Aluminium (18% in 9M FY25 vs 16% in FY24):
Hindalco is the world’s largest aluminum company by revenues and among the global top 5 producers by shipments. It operates across the entire value chain — from bauxite mining, alumina refining, coal mining, captive power, and aluminum smelting to rolling, extrusions, and foils.
Sales (KT):
Upstream: 995 (9M FY25) vs 1,008 (9M FY24)
Downstream: 298 (9M FY25) vs 265 (9M FY24)
4) Chemicals:
The company produces calcined alumina used in grinding media and wear-resistant ceramics, and alumina hydrates used for manufacturing water treatment chemicals such as aluminum sulfate and zeolite.
Geographical Split
- Domestic: 30% in FY24 vs 24% in FY22
- Exports: 70% in FY24 vs 76% in FY22
Manufacturing Capabilities
Hindalco operates 20 plants and 23 bauxite and coal mines in India, along with 32 overseas plants under Novelis, 14 of which include recycling facilities.
Production Capacity (in MnT):
- Alumina: 3.74
- Specialty Alumina: 0.46
- Primary Aluminium: 1.34
- Aluminium VAP: 0.43
- Copper Cathode: 0.42
- Copper Rods: 0.54
- Novelis Aluminum Rolling: 4.2
Capacity Expansion
Novelis: In Q3 FY25, a 100 KT recycling facility was operationalized in Ulsan, South Korea. The company has invested $4.1 Bn in a 600 KT greenfield rolling and recycling plant in Bay Minette, US (expected commissioning: Q2 CY26). It is also expanding recycling and casting in Latchford, UK ($90 Mn) and investing $330 Mn for debottlenecking in Oswego, Logan, and Pinda.
Alumina & Copper: Hindalco is developing an 850 KT Aditya alumina refinery in Odisha (Rs. 7,500–8,000 Cr) and expanding downstream capacity to 600 KTPA. It is also setting up a 50 KT copper recycling plant in Gujarat (Rs. 2,700 Cr) for FY26–FY27 and plans to commission a 25 KT copper inner grooved tube plant by Feb 2025.
Coal Mine Allocation
In Dec 2024, Hindalco secured the Meenakshi Coal Mine in Odisha, a fully explored block with a Peak Rated Capacity (PRC) of 12 MTPA and geological reserves of 285.23 MT.
Renewable Energy Target
Hindalco has a total renewable energy capacity of 189 MW and aims to reach 300 MW by FY25, including 100 MW of solar capacity with hybrid storage.
Nifty 50 Break Out Stock 3 : JSW Steel Ltd
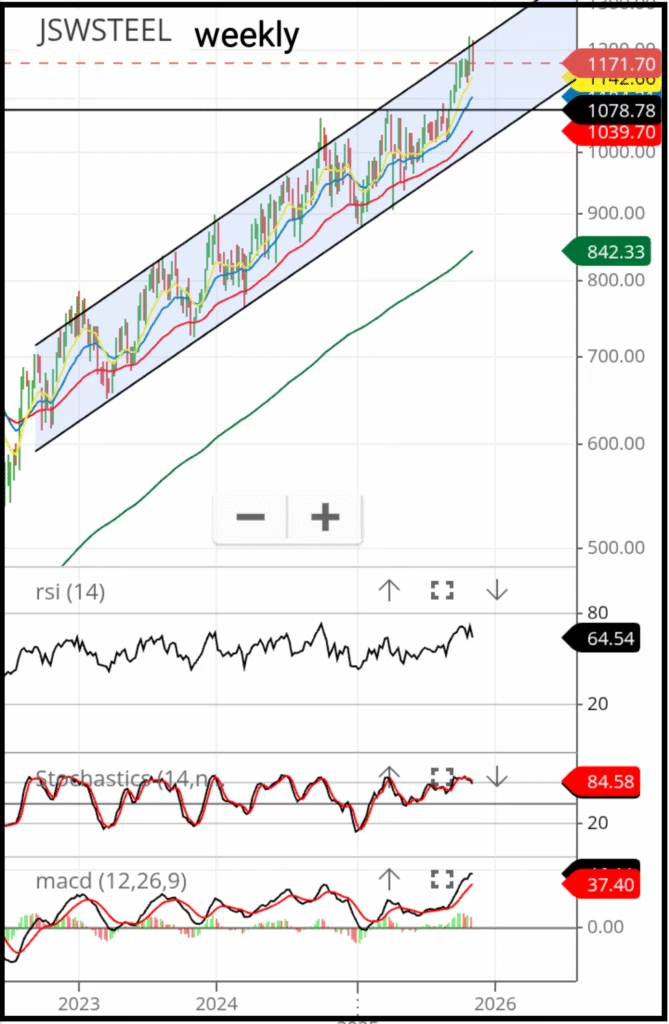
Chart Pattern Analysis
JSW Steel has initiated its upward journey from January 2025. Before entering a sustained uptrend, the stock formed an inverted head and shoulders pattern, a classic bullish reversal signal that indicates underlying strength and accumulation. Following the completion of this pattern, JSW Steel has been moving within an upward-sloping channel, as illustrated in the chart. The breakout occurred during the week ending 26th September 2025, confirming the start of a fresh bullish phase within its long-term trend.
Company Details
JSW Steel Ltd is primarily engaged in the manufacture and sale of Iron and Steel products. It is the flagship company of the diversified US$23 billion JSW Group, which also operates across sectors such as energy, infrastructure, cement, paints, and venture capital.
Parentage
JSW Steel is the flagship entity of the JSW Group, a USD 24 billion diversified conglomerate with interests in energy, infrastructure, cement, paints, real estate, mobility, defense, sports, digital platforms, and venture capital.
Product Portfolio
The company’s product range includes hot-rolled, cold-rolled, galvannealed, galvanized/galvalume, pre-painted, tinplate, electrical steel, TMT bars, and wire rods. These products cater to automotive, general engineering, machinery, and construction industries.
Operational Metrics
- Crude Steel Production (MnT): 20.16 (9M FY25) vs 19.63 (9M FY24)
- Steel Sales (India Operations) (MnT): 18.40 (9M FY25) vs 17.48 (9M FY24)
- Steel Sales (US Operations) (MnT): 0.56 (9M FY25) vs 0.58 (9M FY24)
- Combined Sale Realisations (Rs./Ton): 65,403 (9M FY25) vs 65,581 (9M FY24)
Revenue Mix
a) Product-Wise:
- Hot Rolled: 38% in FY24 vs 33% in FY22
- Longs: 20% in FY24 vs 23% in FY22
- Cold Rolled: 16% in FY24 vs 17% in FY22
- Galvanised/Tinplate: 15% in FY24 vs 15% in FY22
- Colour Coated: 7% in FY24 vs 8% in FY22
b) Geography-Wise:
- Domestic: 79% in FY24 vs 69% in FY22
- Exports: 21% in FY24 vs 31% in FY22
Domestic Sales by Customer Segment (Q3 FY25)
- Retail: 36%
- Construction & Infra: 34%
- Industrial: 17%
- Auto: 12%
Distribution Network
JSW Steel operates 2,339 branded outlets, with 280 additions in FY25 (154 at new locations). This includes 739 JSW Shoppe stores in urban areas and 1,600 JSW Shoppe Connect stores serving semi-urban and rural regions. The network covers 18,500 retail stores in 1,750 towns, supported by 2,820 distribution points (481 distributors + 2,339 branded stores). The JSW Privilege Club has over 1 lakh members, and 28 Experience Centres have been set up across India.
Product Approvals
The company received approvals for 25 new grades/products in Q3 FY25, including Motor Brush Springs, Differential Gears, Flanges, and Spring Steel.
Value-Added Products
JSW Steel offers HRPO, CRFH, CRCA, Electrical Steel, Galvanized, Colour Coated, Tinplate, and Special Bars & Rounds. Specialized variants such as HR Special, TMT Special, and WR Special contributed to 60% of total sales in Q3 FY25. The company aims to keep the value-added product share above 50% of sales.
Strategic Collaboration
JSW Steel has a strategic partnership with Japan’s JFE Steel for high-value steel technology. In Jan 2025, their JV acquired ThyssenKrupp Electrical Steel India and its technology package for Rs. 4,158.6 Cr.
Manufacturing Capacity
The company’s steelmaking capacity stands at 34.2 MTPA in India (including 5 MTPA under commissioning) with a capacity utilization of 91% in Q3 FY25. It also operates a 1.5 MTPA steel plant in Ohio, US.
Expansion
JSW Vijayanagar Metallics Ltd. (a wholly owned subsidiary) is establishing a 5 MTPA integrated steel project at Vijayanagar, expected to complete by Q4 FY25. The company aims to expand its consolidated capacity to 43.5 MTPA within 2–3 years.
JSW One
JSW One is a digital marketplace for MSMEs in manufacturing and construction, providing materials, logistics, and financing. In Q3 FY25, it achieved an annualized GMV of ₹14,000+ Cr, with 1.73 lakh platform visits, 2,400+ customers, and 80% repeat orders. The platform operates 12 service centers and 6 private brand facilities. Its NBFC arm, JSW One Finance, launched in Aug 2024, offers vendor financing and working capital loans.
Debt
Net debt increased from Rs. 56,650 Cr in FY22 to Rs. 80,921 Cr as of Q3 FY25.
Conclusion
The above charts illustrates a breakout pattern on the weekly timeframe, which generally carries greater significance than one observed on a daily chart. Investing based on a weekly breakout does not imply an immediate price surge; short-term pullbacks may occur. However, such corrections are typically followed by a strong rebound, allowing the price to realign with its upward channel. Short-term indicator signals should be disregarded in this context. A more prudent strategy is to accumulate positions when the price approaches the lower boundary of the channel. Avoid panic selling, remain patient, and maintain a long-term perspective to achieve meaningful returns.
Read More