

In numerous articles and books, I repeatedly came across the idea that SIPs (Systematic Investment Plans) operate based on the principle of rupee cost averaging. But what exactly does that mean, and how does SIP work in practice? My intuition suggested there might be more to it than meets the eye. While it is well-known that SIPs can help reduce the average cost of investment over time, I noticed something intriguing in the data—during a consistently rising (trending) market, SIPs can actually increase the average buying cost. This led me to an interesting question: If we plot a graph of the average buying price against the actual market price, would it resemble a long-term moving average chart?
Note to Readers :
Before diving into the main content, I would like to inform you that this article includes a substantial number of charts. These visuals are essential for explaining the concepts clearly and effectively. This is not merely a blog post—it’s designed to resemble a research-backed analysis. Reducing the number of charts would compromise the depth and originality of the article. However, I am confident that anyone who thoroughly understands the concepts presented here will gain the clarity and confidence needed to invest through SIP without fear.
Table of Contents
How Does SIP Work in Practice?
Driven by curiosity, I compiled the monthly closing prices of the Nifty Midcap150 Momentum 50 index from April 2005 to December 2024. Using this data, I conducted several backtesting experiments to analyze the performance of systematic investment plans (SIPs) over different time periods.
I would like to share some of the insights from these experiments:
Average Purchase Price of Monthly SIP vs 50-Period Monthly Moving Average
At first glance, it may seem intuitive to assume that the average purchase price of a Systematic Investment Plan (SIP) would closely track the long-term moving average—such as the 50-period monthly moving average. However, this assumption does not hold true in practice. A closer examination of the charts below reveals a significant deviation between the two.
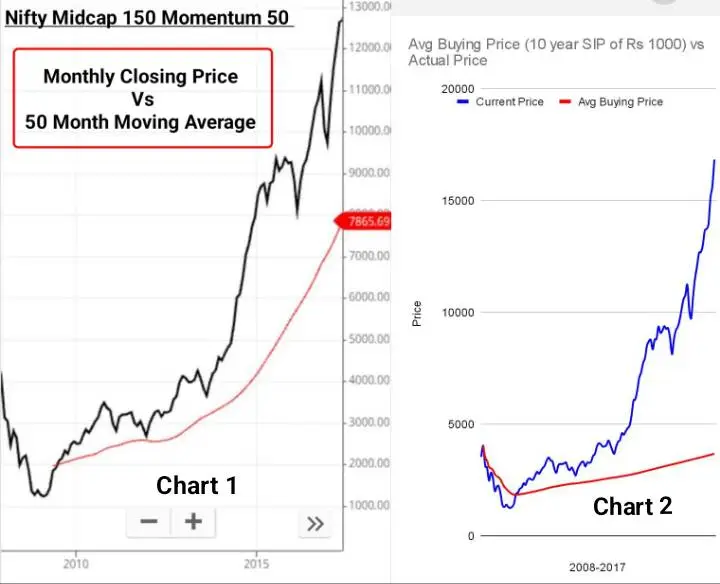
As illustrated above, there are two monthly price charts (spanning from December 2007 to January 2017) of the Nifty Midcap 150 Momentum 50 index, referred to as Chart 1 and Chart 2.
Chart 1 displays the monthly closing price plotted against the 50-period simple moving average (SMA).
Chart 2 presents the monthly closing price in comparison to the average purchase price derived from a systematic investment plan (SIP) executed monthly.
Key Observations from Chart 1 and Chart 2:
1.Responsiveness:
The 50-period moving average line reacts more swiftly to price changes than the average SIP buying price line.
2.Trend Alignment :
The moving average closely follows the direction of the closing price, both during uptrends and downtrends.
3. SIP Behaviour in Declines :
The average SIP buying price tends to trail the closing price, especially when the market is in decline.
4. Crucial Insight :
A significant observation is that the SIP average buying price rises very gradually when the market is trending upwards. Over time, this line appears to flatten, indicating its reduced sensitivity to short-term price surges.
First Scenario Analysis – Global Financial Crises 2008
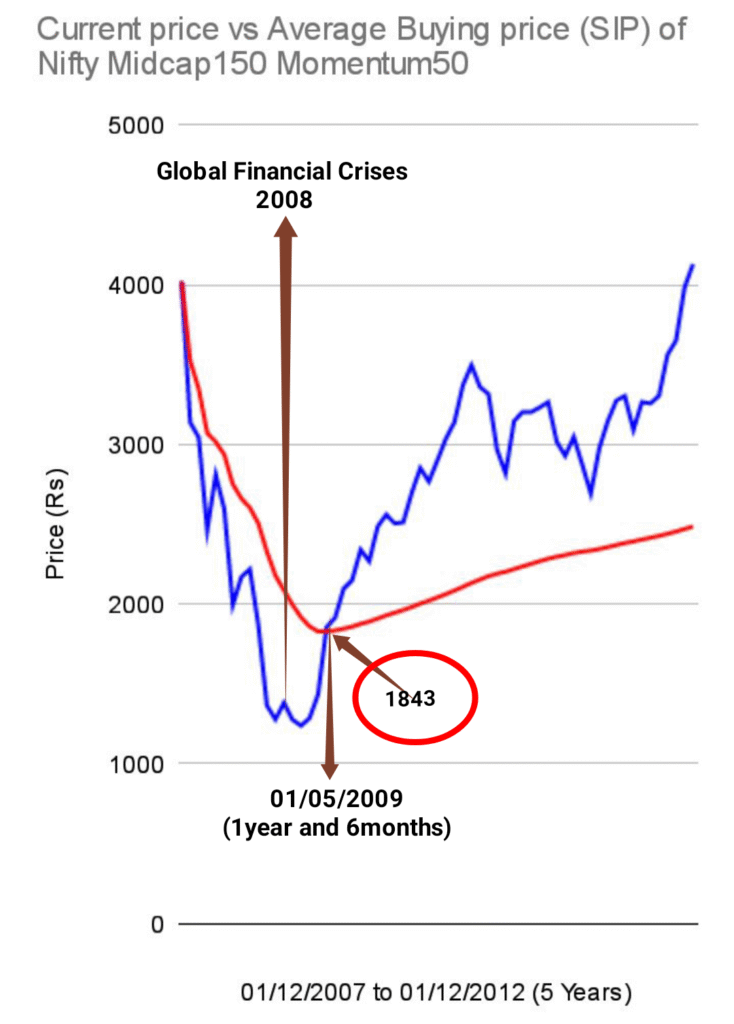
Inferences from the Above Chart:
1. SIPs help lower the average purchase cost during a declining market, providing effective downside protection.
2. Conversely, SIPs tend to increase the average purchase cost in a rising market.
3. The rate at which the average purchase price declines is steeper than the rate at which it rises.
4. The first investment was made at a price of ₹4,016 on the last trading day of December 2007.
5. The recovery price was ₹1,843 on the last trading day of May 2009, indicating that it took only one year and six months to recover from the downturn.
6. In comparison, a lump sum investment made in December 2007 would have taken approximately five years to recover.
This suggests that SIPs perform more favorably during market downturns than in continuously rising markets. But does this hold true over the long term—say, over a period of ten years?
To explore this, I will now extend the analysis to cover data up to 2017.
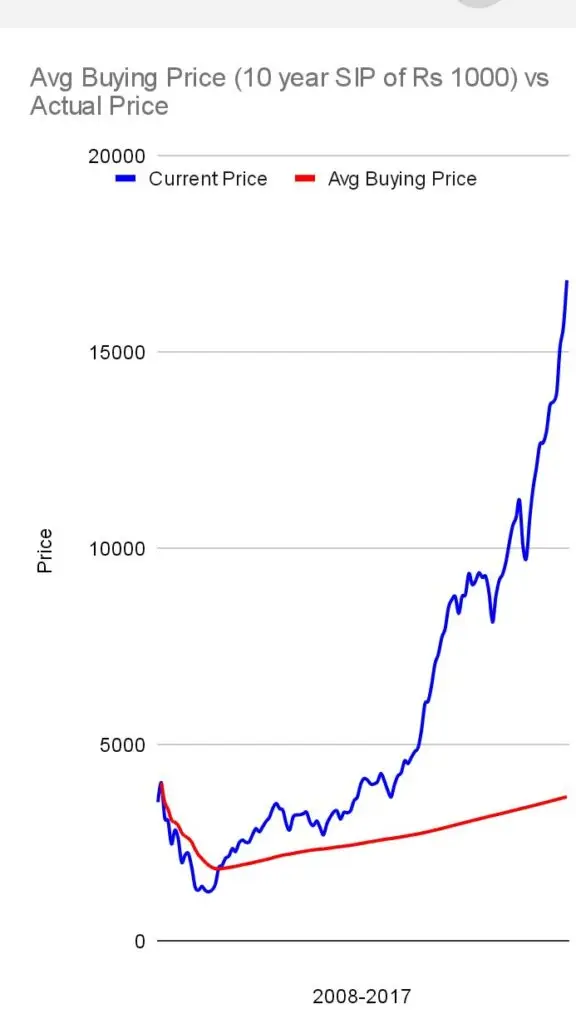
Inferences from the Chart :
1. In the initial phase (approximately the first one and half years), a SIP (Systematic Investment Plan) helps reduce the average purchase price in a declining market.
2. Over the long term, a SIP moderates the rate at which the average purchase price increases in a rising market. This effect enhances overall profitability and demonstrates that the role of a SIP is even more significant in an upward-trending market than in a downward one.
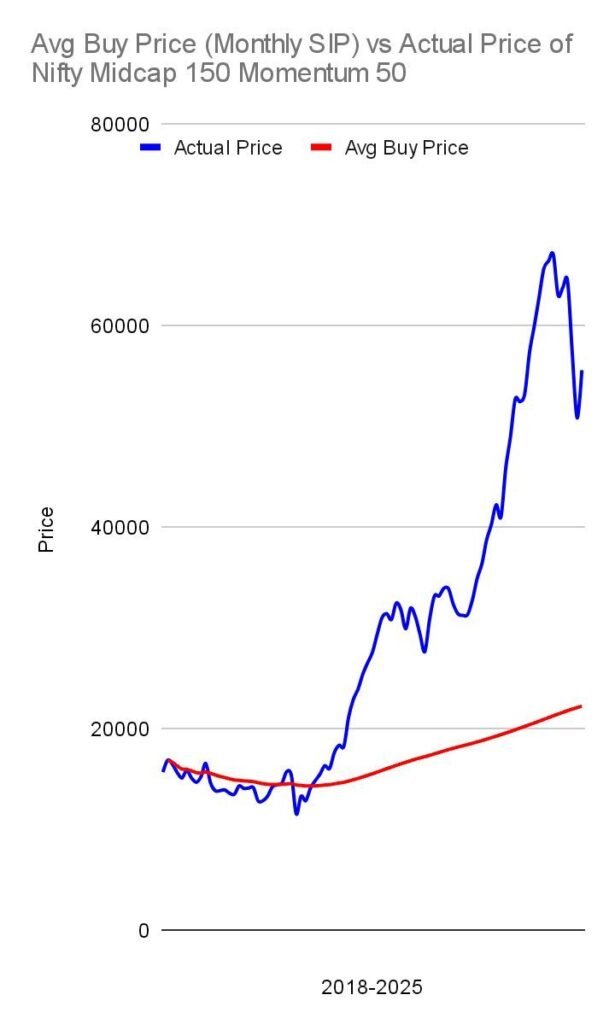
An extended projection of the chart through 2025 further validates these observations.
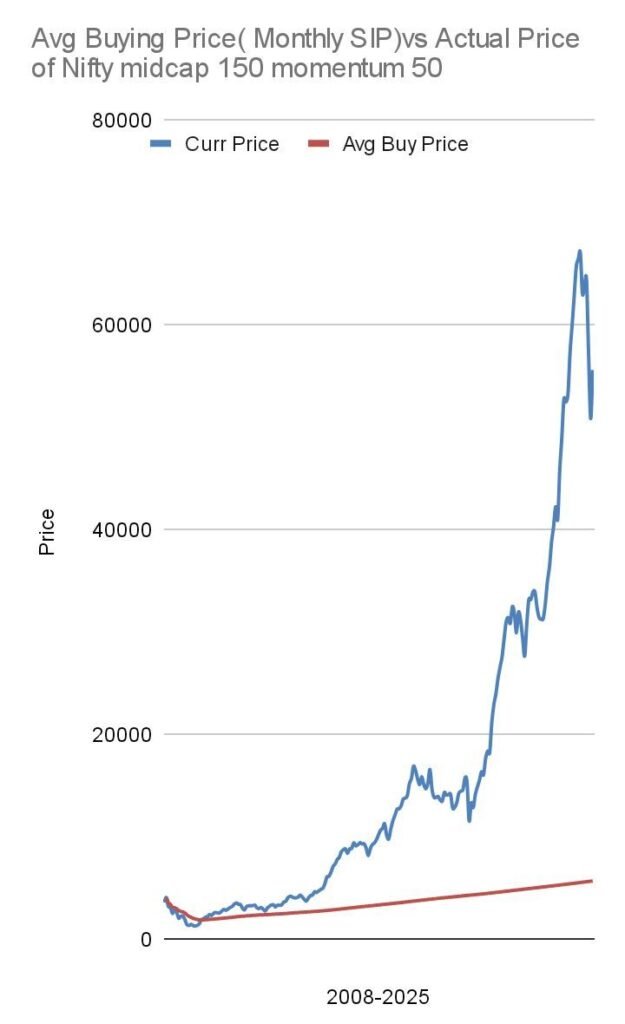
Inferences from the Chart :
Over the long term, the average purchase price achieved through a SIP appears as a smooth, almost flat line with a very slight upward slope. This indicates that the increase in the average buying price is minimal, even during prolonged market uptrends. As a result, investors benefit significantly, as the negligible upward movement of the average purchase price translates into substantial long-term profits.
A Surprising Insight
Consider this question:
If one investor began a SIP investment (over Nifty Midcap Momentum 50)on the last trading day of December 2007—just before the onset of the global financial crisis—at a price of 4,019, and another investor started a SIP(over Nifty Midcap Momentum 50) on the last trading day of February 2009—immediately after the crisis ended—at a price of 1,239, who would benefit more in the long run in terms of a lower average purchase price?
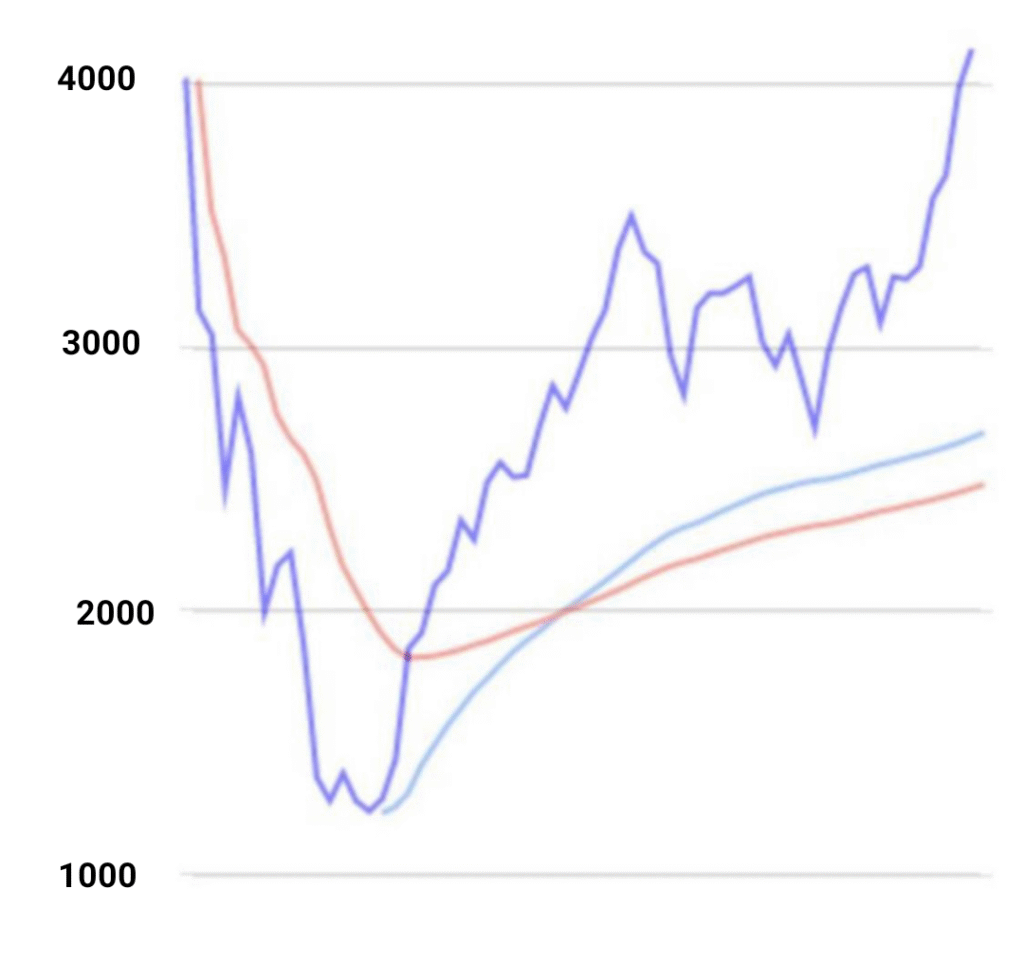
Chart Details :
Deep blue line – Chart of Nifty Midcap 150 Momentum 50 & Red line – Average purchase price of Sip started on December 2007 & Sky Blue line – Average purchase price of Sip started on February 2009
Inference from the Chart:
The chart provides a clear answer: the early investor ultimately achieves a lower average buying price than the one who entered the market later at a seemingly more attractive price. This demonstrates the timeless lesson that “the early bird catches the worm,” highlighting the long-term advantage of staying invested through market cycles rather than attempting to time the market perfectly.
Second Scenario Analysis: Covid19 Crash- 2020 :
Let us consider another instance: What happens if an individual starts a monthly SIP of ₹10,000 during the recession that began in December 2017 and lasted until March 2020?
Insights from the Chart:
1. The recovery period for the SIP investment lasted approximately 2 years and 9 months, whereas a lump sum investment took about 3 years and 1 month to fully recover from losses.
2. Throughout the recession period, the average buying price consistently declined.
3. The initial investment was made at a price level of 16,832, and by the end of the recession, the average buying price had decreased to 14,545.
Extension: December 2017 to December 2025 — What Happened Next?
Key Inferences
1. The wait of nearly three years for recovery was, in fact, an opportunity to accumulate the maximum number of units at lower prices.
2. In the subsequent three years following the recovery, the total value of the investment grew to approximately three times the average buying price, demonstrating significant wealth creation.
3. The upward movement of the average buying price continued to decelerate over time, indicating price stability.
4. The average buying price eventually entered a ‘no-risk’ zone, as it reached nearly one-third of the prevailing market price, providing a substantial margin of safety.
Third Scenario Analysis – Harshad Mehta Scam, Y2K Problem, Dotcom Crash – 1992 to 2003
I initially intended to conduct this research using the Nifty Midcap 150 Momentum 50 index. However, since this strategy index was launched by NSE only on 1st April 2005, I decided to proceed with my experiments using the Nifty 50 index instead. The results of this backtesting provided valuable insights into a critical question: How long should one continue a SIP investment? Let’s examine the chart with a detailed perspective.
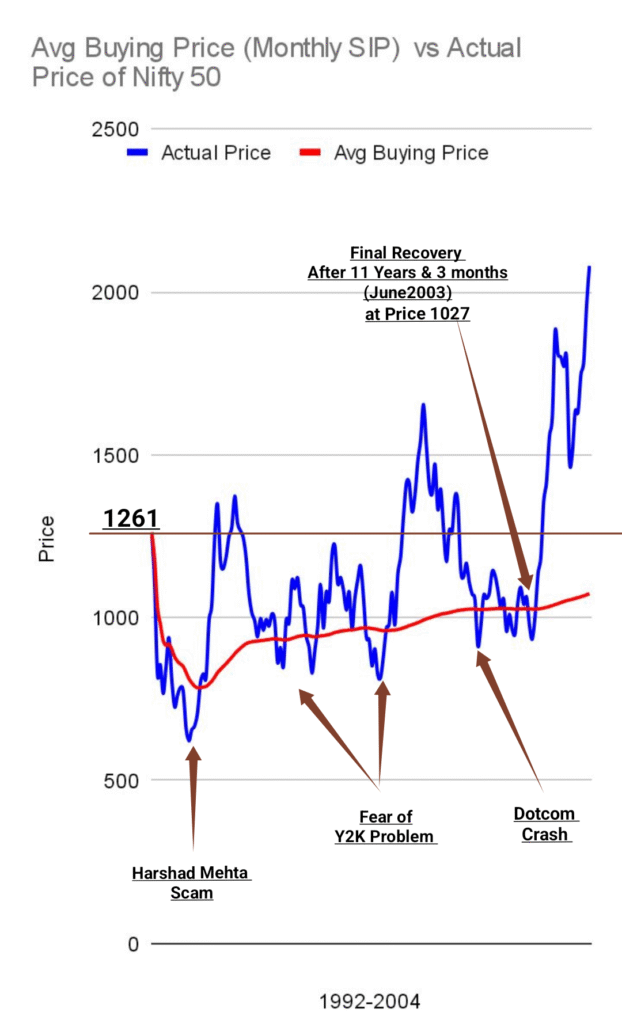
The above chart is reflecting the behaviour of average purchase price of SIP from 1992 to2004
Observations from the Chart:
1. This period represents one of the most challenging phases in the history of the Indian stock market. To overcome the 3 periods of recession (Harshad Mehta Scam, Y2K Problem and Dot com Crash), Nifty 50 could hardly make any consistent substantial up move.
2. The SIP commenced at an index level of Rs 1261, but over time, the average buying price declined to Rs 785 and remained below Rs 1000 until April 2000.
3. No sustained profit was realized until June 2003, implying a waiting period of 11 years and 3 months before achieving consistent lifetime gains.
4. From 1995 onwards, the occurrence of losses significantly reduced, as the average buying price consistently hovered near or below Rs 1000.
5. By 1997, the average buying price effectively mirrored a lumpsum investment made close to Rs 1000, highlighting that the initial five years of SIP contributions constitute the most crucial phase of the investment journey.
When Should You Stop SIP Investments?
An extended period of 11 years and 3 months without substantial returns, due to unfavorable market conditions, can be discouraging for any investor. However, it is important to approach this strategically. You may choose to stop making additional SIP contributions anytime after completing five years, but it is advisable to remain invested until the market price becomes at least three times your average purchase price. This is because, beyond five years, the average buying price typically stabilizes with minimal fluctuations.
Importantly, avoid exiting your investment prematurely. As Brian Tracy wisely advises, “No goal is unrealistic; only the deadlines may be.” Therefore, if necessary, extend your investment horizon rather than compromising on your financial goals. It is generally prudent to continue your SIP investments until you achieve your intended financial objectives.
The chart below illustrates the impact on the average purchase price when additional investments are discontinued after five years.
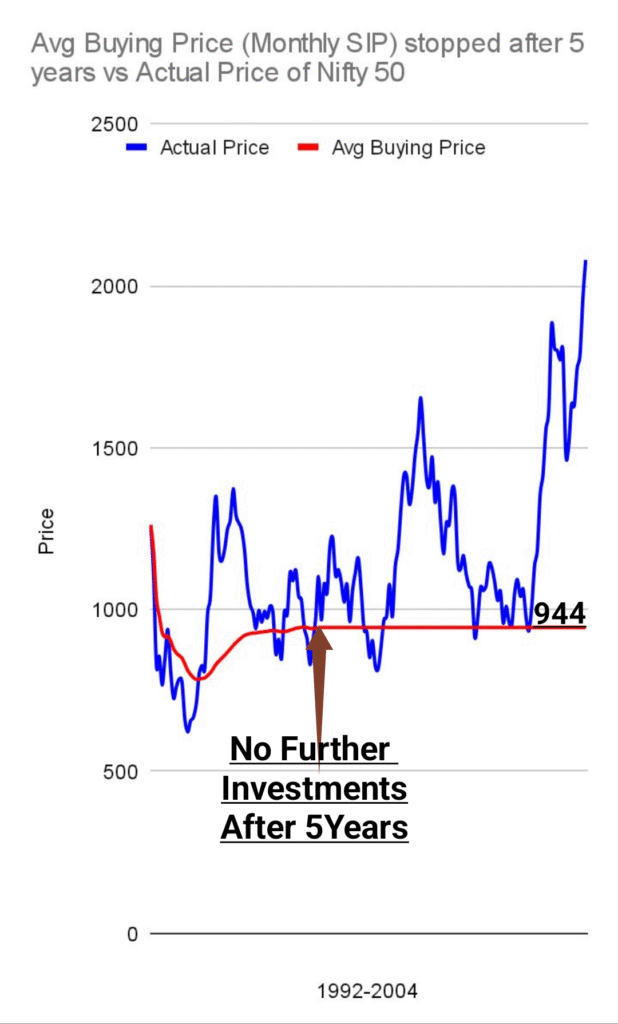
The chart is showing how the average purchase price would be effected if further investments of SIP is stopped after 5 years.
Inferences from the Chart:
1. After five years, the average buying price stabilizes at approximately ₹944.
2. The percentage profit in this scenario is expected to be higher compared to a standard SIP investment coninued after five years.
3. The lower price levels of the Nifty 50 are effectively averaged during the initial five-year period.
4. The movement in the average purchase price significantly declines after the third year.
Key Takeaways :
1. Patience is Paramount:
Consistency and discipline are the cornerstones of SIP investing. One should never discontinue SIP contributions, regardless of market conditions, because the long-term reward is virtually assured.
2. Understand the Two Phases of SIP:
SIP investing naturally unfolds in two distinct phases:
Wealth Accumulation Phase:
Years 0 to 5 — This phase is akin to constructing a robust money-making machine by accumulating a significant number of units at various price levels.
Wealth Creation Phase:
Year 5 onwards — This is when the machine starts generating substantial wealth through the compounding effect and market growth. This phase continues for as long as the investment remains active, ideally up to the investor’s lifetime.
In essence, the initial years of a SIP lay the foundation for a strong financial future, while the subsequent years allow investors to reap the benefits of this disciplined strategy. Staying invested and trusting the process is key to transforming modest, regular contributions into significant long-term wealth.
Disclaimer:
“This article is for educational purposes only. Read our full disclaimer .”


One thought on “Practical Analysis : SIP Work Like a Money Making Machine”